
Introduction
J-20 is the world’s third operational fifth-generation stealth fighter aircraft after the F-22 and F-35. It made China the second country in the world after the USA to operate a fleet of stealth fighter. By the time this article is published, it is estimate that there are around 208 J-20 produced.

Goals of the simulation:
The aim of our simulation is to evaluate the mean and median radar cross section as well as the radar scattering pattern of the J-20 at 4 frequencies:
- VHF – 150 MHz
- L Band – 1150 MHz
- S Band – 3150 MHz
- X Band – 8150 MHz
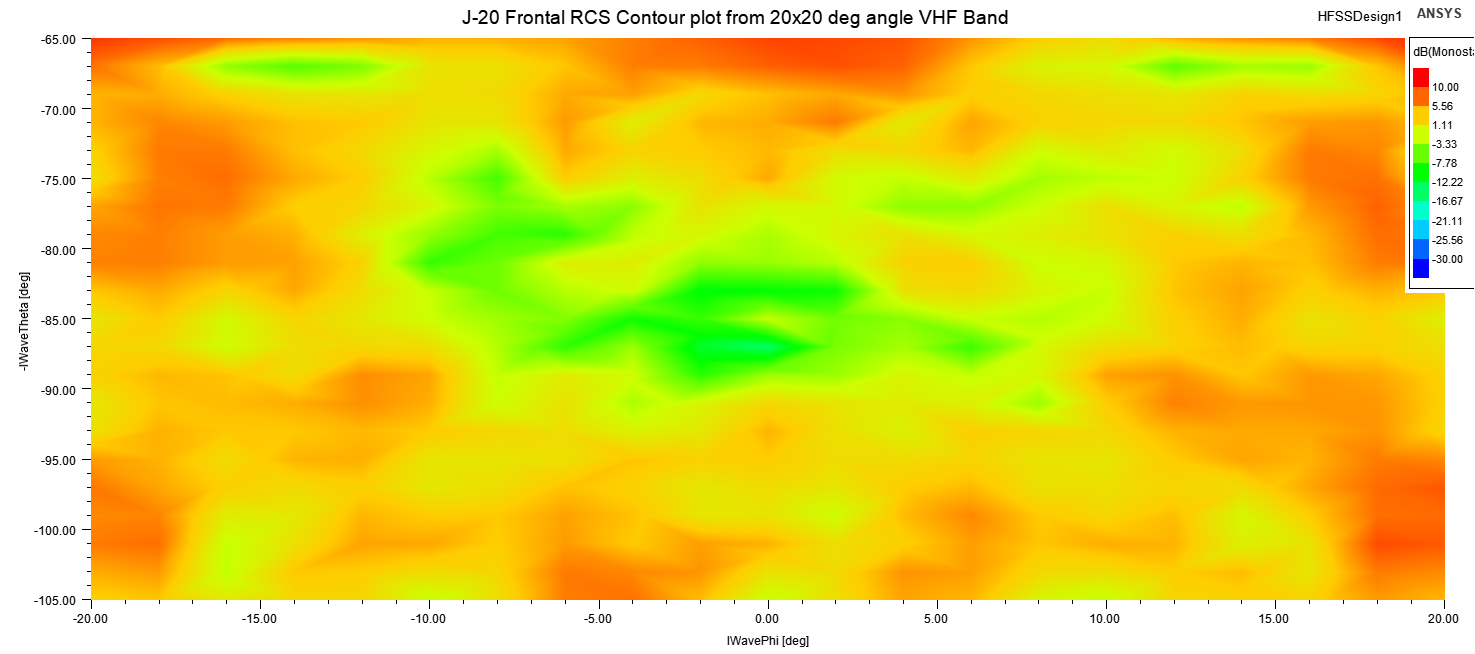
.Because stealth aircraft tend to deflect radar signal away from the source, so a change in total arcs can have a big impact on median and mean RCS. So the mean and median RCS of J-20 will be simulated and calculated for 2 cases with different frontal arcs value.
- Case 1 simulates situation when the stealth aircraft have to face multiple radars located far from each others, thus they can illuminate the fighter from directions where the strong reflection lobes located
- Case 2 simulates situation when aircraft face small number of radars located close together so the stealth fighter can turn its nose toward targets
The details are in the following table:

Note: The contour map results for Case 2 is actually a part of Case 1 contour map, but it will be shown separately so that viewer can have an easier time visualize the radar lobes arrangement and how direction affect stealth fighter RCS.
Explanation of some terms:
Median RCS is the middle RCS value of all RCS data. Which mean 50% of RCS spike inside the arcs will be higher than the median value, and the others 50% of RCS spike inside the arcs will be smaller than the median value
Mean RCS is the average of all RCS data.
It is very important to remember that both Median and Mean RCS does not tell the whole story, two object with the same Median and Mean RCS does not necessary equally visible to radar when viewed from the same direction ,thus we also need the contour map to see the arrangement of the reflection lobes.
RCS value illustrated inside the contour map will be measured in dBsm. To convert RCS between dBsm and m2, we can use the following guidance.
CONVERTING RADAR CROSS SECTION IN SQUARE METERS TO DECIBELS
dBsm = 10 x log10(RCS/1m2)
CONVERTING RADAR CROSS SECTION IN DECIBELS TO SQUARE METERS
RCS = 10(Decibels/10)
Basics Rules:
Because not every information about J-20 is available in the public sectors, we will follow several rules in the simulation.
- In real life, J-20 skin has a layer of radar absorbing material (RAM) to absorbing radar energy. However, in this simulation, all external surface including the canopy will be treated as perfect electrical conductor (meaning they will reflect radio wave like metal)
- Stealth fighter will have trailing edge and leading edge treatment on its wings, horizontal and vertical stabilizers as well as inlet lips to reduce the magnitude of radar return from edge scattering and creeping wave return effect. But those effect were not added in our previous simulation for F-35 and Su-57 because there wasn’t enough information about their leading and trailing edge treatment. However, this time, the trailing edge treatment on the canard and main wing of J-20 in the form of edge serration will be simulated because they are very easily to identify visually
- J-20 radome is a FSS radome, so it will be treated as perfect electrical conductor for all frequencies except the bandpass frequency
- Luneburg lens which often used to increase stealth aircraft’s RCS will not be included in this simulation
- All cooling vents will be modeled
- The inlet , the radar blocker and the first 2 fan stages of 2 × WS-10C engine will be modeled
- Even though there is no current data on the absorbing capability of the RAM used by J-20. The inner surface of the inlet duct from the start of DSI bump leading to the engine stages and the radar blocker will be coated with a layer of MnZn ferrite RAM. This rule is made due to the fact that it is not possible to evaluate the RCS reduction effect of S-duct inlet without a layer of RAM added. The absorbing capability of the MnZn RAM will be based on actual real world measurement data. The current absorbing capability of the RAM used in our simulation is around -8 dB at 8.15 GHz and -4 dBsm at 3.15 GHz. Keep in mind though that actual RAM used on stealth aircraft may have absorbing rating of -15 to -25 dB depend on the actual frequency.


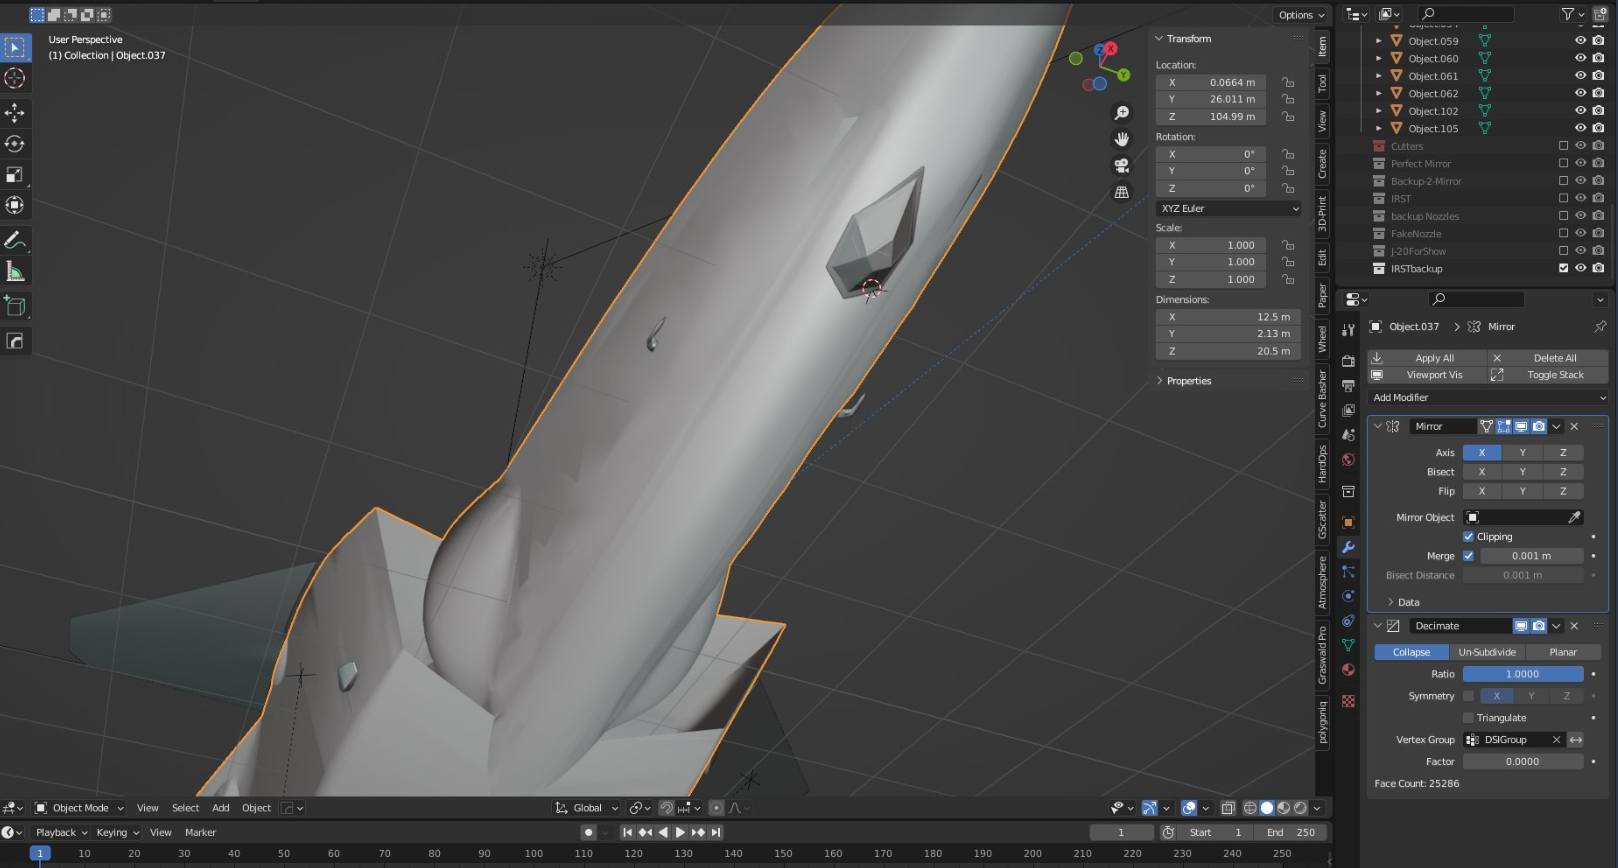
Software used:
- Model of the J-20 is created using SolidWorks software, the model of the Infrared pod (Chinese EOTS) is created by Autodesk FBX. They are then converted to the same format to be added together.
- In most studies, radar scattering simulations are often done using POFACETS because it can run on most commercially available computer and provides convenient run–times. Unfortunately because POFACETS only rely on Physical Optics method to predict the RCS of target. As a result, it cannot take into account phenomena such as creeping waves return, thus lead to underestimation of target RCS value. Hence this radar scattering simulation will be done using Ansys HFSS. HFSS allows edge scattering, creeping wave, cavity return to be simulated accurately, thus it will be our chosen software.
Model photos:
OUTSIDE:
Top view

Side view

Bottom View

Head on view

Tail on view

SMALL PARTS AND REFERENCE IMAGES
EOTS window and pitot tube


Canard root hump and antenna hump


Wing actuator humps and small humps near ventral fins


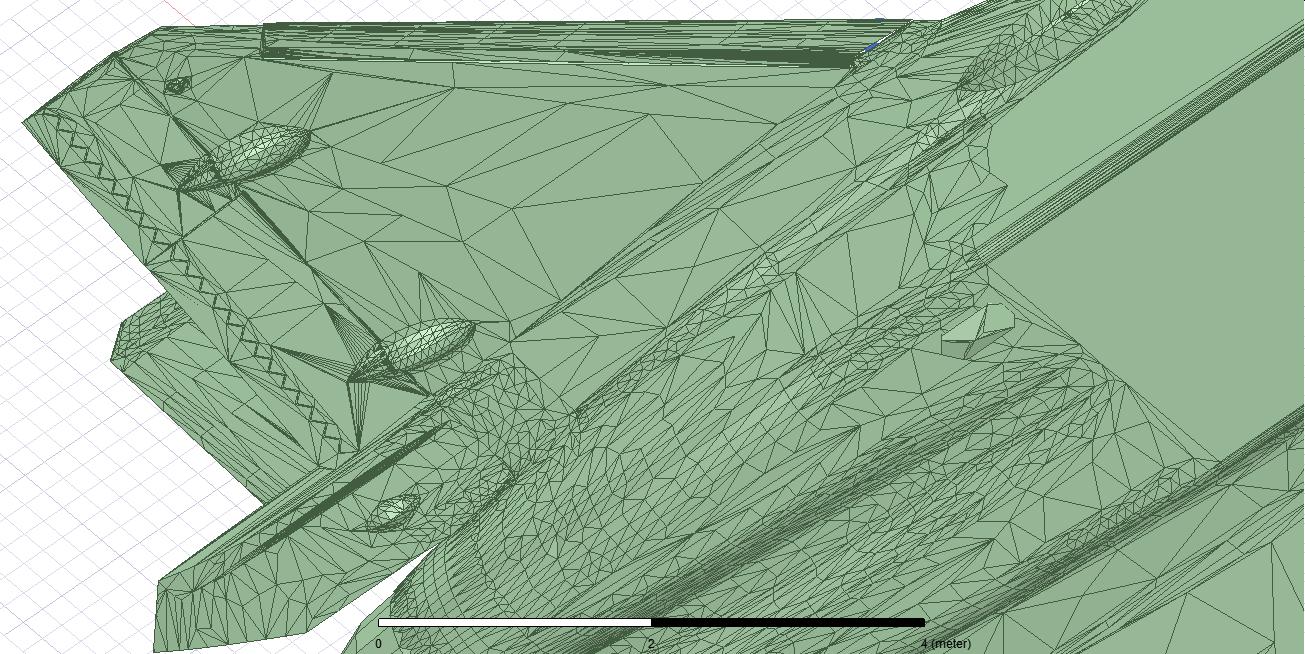
Humps on LERX, and belly DAS sensor


Trailing edge serration treatment on main wing and canards


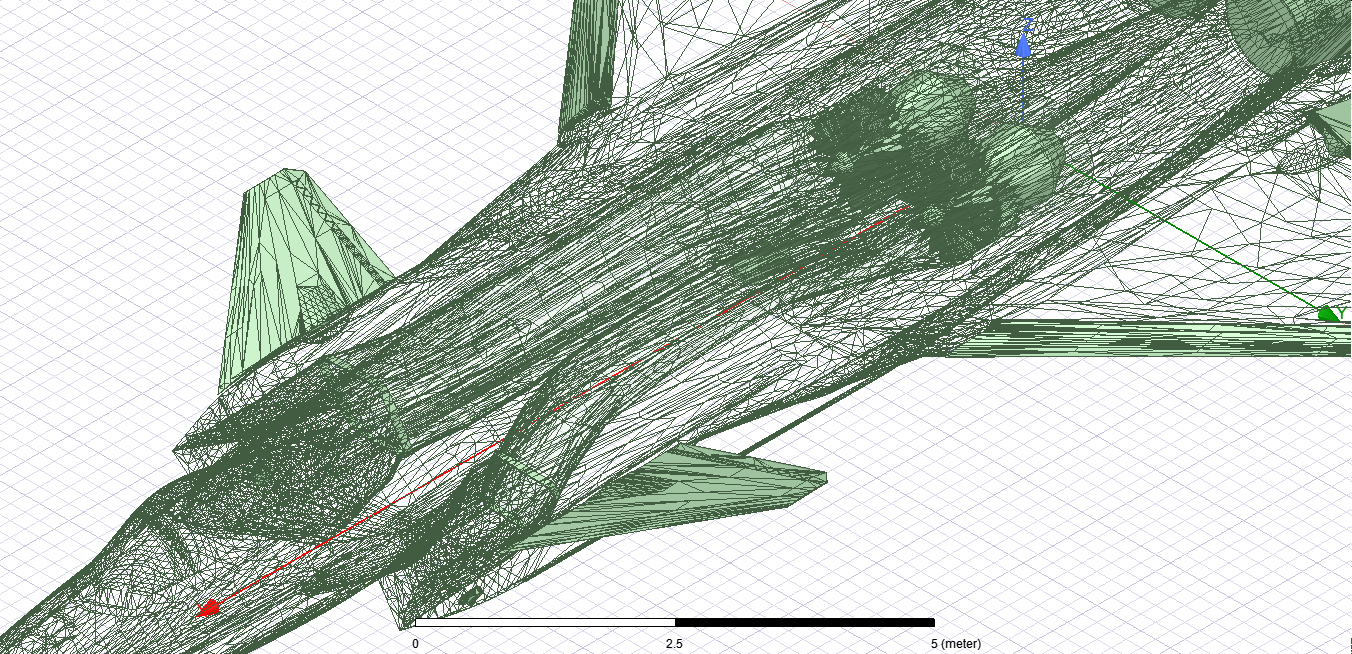
INTERNAL PARTS – S-duct Inlet and engine

Contour Map Result
- VHF band result of clean J-20 in Case 1 (-60° to +60° horizontal arc, -22° to +22° vertical arc)

- VHF band result of clean J-20 in Case 2 (-20° to +20° horizontal arc, -20° to +20° vertical arc)
- L-band result of clean J-20 in Case 1 (-60° to +60° horizontal arc, -22° to +22° vertical arc)

- L-band result of clean J-20 in Case 2 (-20° to +20° horizontal arc, -20° to +20° vertical arc)

- S-band result of clean J-20 in Case 1 (-60° to +60° horizontal arc, -22° to +22° vertical arc)

- S-band result of clean J-20 in Case 2 (-20° to +20° horizontal arc, -20° to +20° vertical arc)

- X-band result of clean J-20 in Case 1 (-60° to +60° horizontal arc, -22° to +22° vertical arc)

- X-band result of clean J-20 in Case 2 (-20° to +20° horizontal arc, -20° to +20° vertical arc)

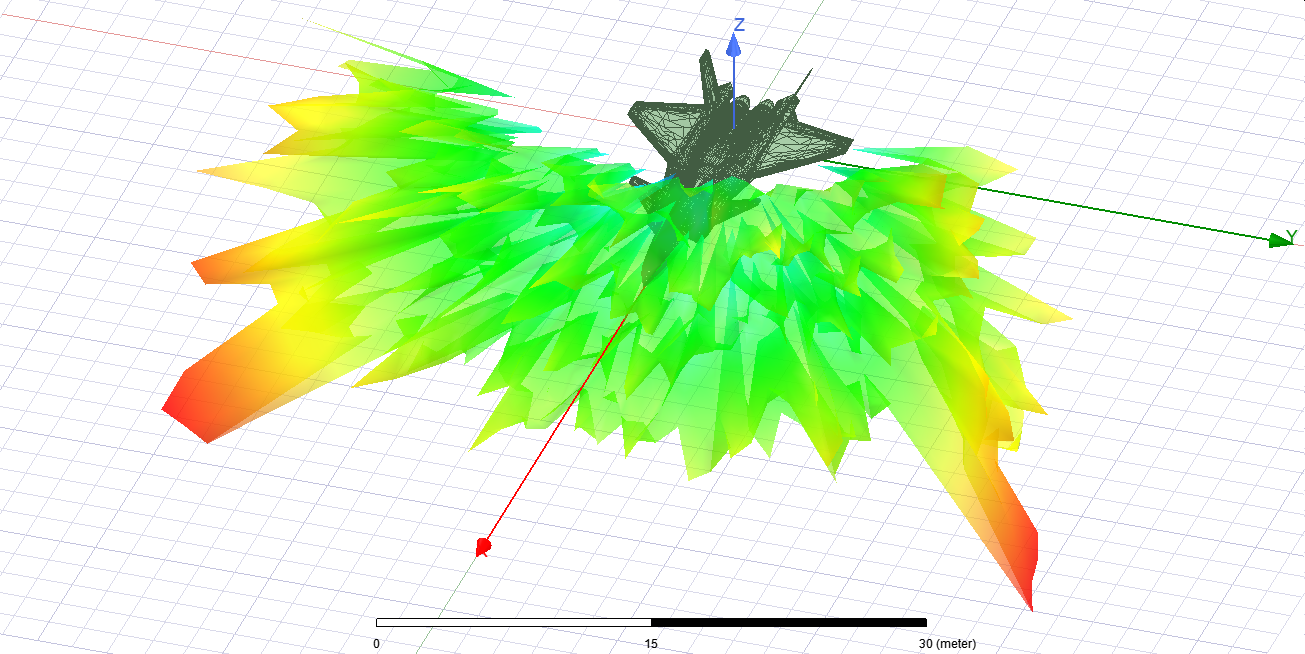
3D Maps Result:
- VHF band result of clean J-20


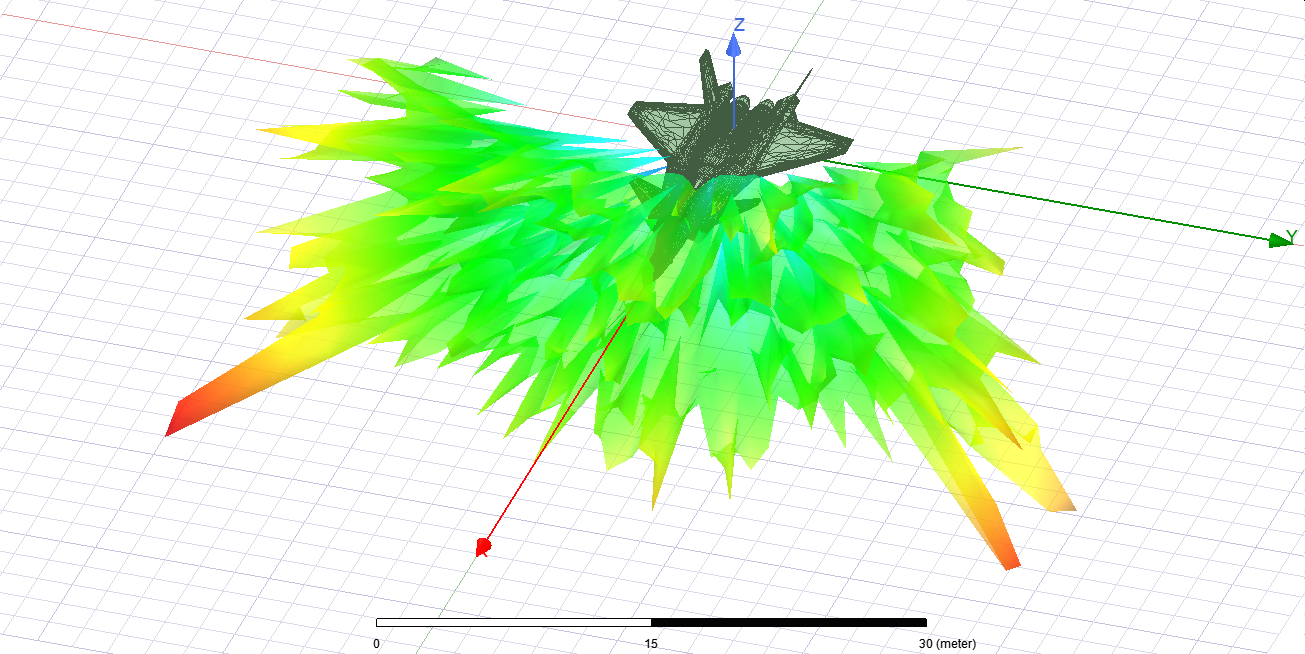
- L-band result of clean J-20


- S-band result of clean J-20

- X-band result of clean J-20

SUMMARY:
From the simulation results, it is easy to note that J-20 has good signature characteristic. Even though, J-20 RCS is higher than F-35A RCS through the frequency range (approximately 3.5 times in X-band, 1.5 times in VHF band), it still has much better RCS characteristic when compared to Su-57. The canard return blended very well with the main wing return, and due to their high swept angle, the first high RCS spike of J-20 actually located at around 50 degrees boresight. This mean it is very easy for J-20 pilots to keep enemy adversary within their stealthy sector. Add to the fact that J-20 has very big antenna aperture, it can be highly lethal in BVR combat.

References
Big thanks to: Stealthflankers, Akela Freedom, Eloise for helping me materialize this project.

Wow, I’ll take this as a bday gift! Thanks for your continued hard work!
I’m surprised the RCS figures are somewhat similar between the F-35 and J-20, I know the J-20 had edge treatment but still. How much higher do you suppose the RCS would be without the leading and trailing edge treatment?
Do you watch the World Cup? If so, who you rooting for?
LikeLike
I think you should have modeled the serrated nozzles which are becoming standard on J-20.
LikeLike
This is only for frontal aspect so serrated nozzle and conventional nozzle are pretty much the same though
LikeLike
Nice work
The furure turkish Kizilelma UCAV from Baykar is similar to the J-20 in some ways. This article gives some insight to its low RCS capability.
LikeLike
Amazing work!
Any info on the RCS from sides/rear? Would be interesting to see how serrated nozzles affect the radar signature.
Also, keep in mind that the canards would move in flight, which might affect RCS.
LikeLike
the vertical stabilizer will move in flight as well…..
LikeLike
Will you be doing the B-2 in the future? Curious how a flying wing with no vertical surfaces compares against the stealth fighters despite the huge size difference
LikeLike
Iam actually making the B-2 model at the moment
LikeLike
That’s incredible news! Will you be modeling edge treatments with this one or will it stay consistent with the other 2 btw
LikeLike
Unfortunatelly, it must stay consistent with the other two because the content of edge treatment on B-2 is not easy to identify for modeling
LikeLike
I see no issue with that, it’ll keep it consistent with the other two which will make direct comparisons easier
So I guess that’s the advantage of that
LikeLiked by 1 person
All I can say is wonderful.
LikeLiked by 1 person
Can you say anything about how particular features affect the RCS? For instance, the F-35 doesn’t have the bumps for the wing actuators that the J-35 has. How much difference do those make?
I don’t know how much time it takes to run these simulations. I’m wondering if you can run pairs with features and without to see what difference it makes.
The F-35 has it’s leading and trailing edges aligned in plan view (but the trailing edges on one side don’t align with the leading edges on the other). The J-35 canard trailing edge doesn’t align to the wing trailing edge, and the LERX doesn’t align to anything else at all. Can you say anything about how these misalignments have affected the J-35 RCS?
LikeLike
After the B-2, is the F-22 next?
LikeLike
Good work. Could you also do the Gripen E?
Greetings from Brazil
LikeLike
I will do Eurofighter next, then Mig-31, then F-16, only after that is Gripen
LikeLike
Could you please do one on the YF-23 ? I believe that the F-22 was slightly stealthier than the YF-23 even though aviation fanboys think otherwise, it would be incredible to compare the RCS of the YF-23 to the stealth fighters currently in service.
LikeLike
I can do YF-23, but it won’t be anytime soon because aircraft in service take higher priority
LikeLike
You have the YF-23 3D model ?
Two researchers – one Taiwanese, the other Brazilian, whom I corresponded with, said they would like to do a simulation of the YF-23, but could not find the proper 3D model, like those by FEKO.
LikeLike
we literally have to make the model ourselves, normally Eloise will make these model then stealthflanker fix the details
LikeLike
The YF-23’s rhombus wings, repeated in exact parallel unison at the ruddervators and engine exhausts, clearly confer it a very low RCS from its fundamental shape alone, without RAM.
The F-22 is grossly overrated. Without RAM, it cannot survive.
Northrop’s Chief Scientist, Liu Yu-Ping, on receiving the news that the F-22 had won the ATF competition in March 1991 :
” I was crushed. We knew their (RCS) figures and there was no reason why we would lose.”
LikeLike
Could you give the decibel
numbers for 3 Ghz and 10 Ghz ?
I am more used to reading the 360° round chart plots, and have difficulty interpreting your colored plots.
LikeLiked by 1 person
You can see it at the end of this articles
LikeLike
The only reason the F-22 won was Sam Nunn was heading the Senate Armed Services Committee.
Sam Nunn was also Senator of Georgia, where Lockheed’s factory was located. The factory was redundant with no work at that time.
The YF-23, particularly Gray Ghost, the second prototype with the General Electric F120 engines, was far stealthier, accelerated and supercruised much faster than the YF-22,
Rumor has it that Gray Ghost supercruised past Mach 2.
LikeLike
实际上j20已经有好几个新的型号了,可以更新一下模型了
LikeLike