Introduction
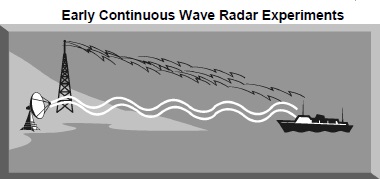
The word “RADAR” is an acronym for RAdio Detection And Ranging. As it was originally conceived, radio waves were used to detect the presence of a target and to determine its distance or range.The reflection of radio waves by objects was first noted more than a century ago. In 1903, the reflection of radio waves was employed in Germany to demonstrate detection of ships at sea.In 1922, Marconi presented the same idea in Britain but received little official interest. These early experiments used continuous wave, or CW, transmissions and relied on the reflection of a transmitted wave from a target to indicate the presence of a target. CW transmissions can detect the presence of an object and, if the radio wave is formed into a narrow beam, can also provide azimuth information. CW transmissions cannot provide range.
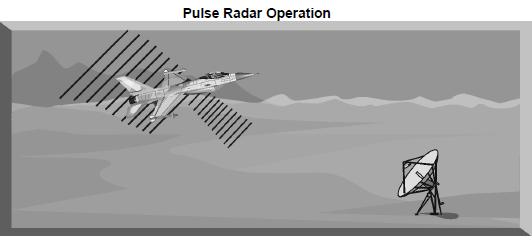
The lack of range information was a serious limitation but was finally overcome by modulating the radio wave transmissions to send out a train of short pulses. The time between pulse transmission and an echo return to the receiver provides a direct measurement of range

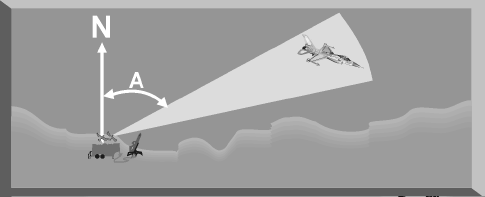
Target angle discrimination is another critical capability of radar systems. In order for a radar system to detect a target, the antenna must be pointed at the target during the transmission and reception of RF energy. The ability of a radar system to accurately determine angle is a function of the horizontal beamwidth of the antenna. If the radar sweep is referenced to true North, the angle of a radar return can be measured relative to true North.
Determining targets velocity is an important capability of radar systems, to achieve that radars take advantage of Doppler effect. Doppler effect is the phenomenon that frequency of radio waves will be changed or shifted when reflected from a target moving relative to the radar. To measure exact speed the central processor of radar calculate the different between the frequency of transmitted wave and frequency of reflected wave . In pictures below fo is the transmitted frequency of the radar, and ft is the frequency of the reflected wave.
- For a stationary target, the frequency of the reflected signal will equal the frequency of the transmitted signal

- For a target moving toward the radar, the frequency of the reflected signal will be higher than the transmitted signal

- The reflected frequency for a target moving away from the radar will be lower than the transmitted frequency


It important to remember that factors affect Doppler shift is not target absolute velocity but target’s radial velocity. As a result aspect angle between target and radar is very important.

Basics Glossary
Frequency

The frequency of the transmitted signal is the number of times per second the RF energy completes one cycle
Wavelength
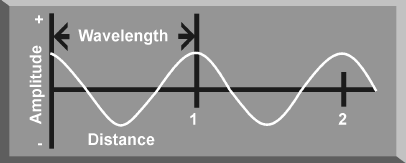
A characteristic of any RF signal is wavelength. Wavelength is a measure of the physical distance between peaks of a sine wave propagated in space.most radar signals have wavelengths measured in centimeters or millimeters.Wavelength and frequency have inverse relationship: the higher the frequency, the shorter the wavelength

Polarization
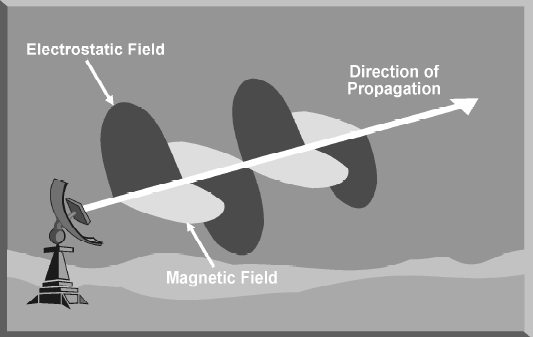
Polarization is the orientation of the RF wave as it travels through space .There are two types of polarization: linear and circular .Polarization is determined by the radar antenna
- Traveling electromagnetic energy has two components: an electrostatic field and a magnetic field. These two fields are always perpendicular to each other and perpendicular to the direction of travel. The polarization of the wave is defined in terms of the orientation to the electrostatic field. Many radar antennas are linearly polarized, either vertically or horizontally. The signal depicted below is vertically polarized.
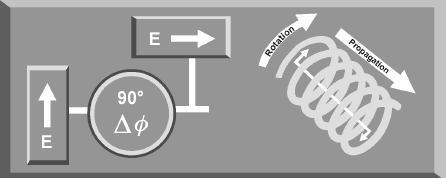
- Some radars use circular polarization to improve target detection in rain. Circular polarization can be right-hand, or left-hand orientation. For circular polarization, the direction of the electrostatic field varies with time and traces a circular locus about a fixed plane perpendicular to the direction of propagation. For a right-hand circular polarized signal, the electrostatic vector appears to rotate in a clockwise direction. For a left-hand circular polarized signal, the rotation is counterclockwise. Circular polarization can be visualized by pointing the thumb of either hand in the direction of propagation and curling the fingers in the direction of electrostatic field rotation.
- The impact of polarization on receivers and transmitters is fairly clear . If an antenna is designed to receive a particular polarization, it will have difficulty receiving a signal with an opposite polarization. This situation is defined as cross polarization.The impact of cross polarization on electronic combat can be dramatic. If a radar warning receiver antenna is polarized to receive vertically polarized signals, a threat system employing a horizontally polarized radar signal may not be detected.Moreover ,if the jamming antenna on an electronic attack (EA) system is also vertically polarized, it may not be able to jam this system.
 The table below illustrates the impact of polarization on selected transmit and receive antenna combinations:
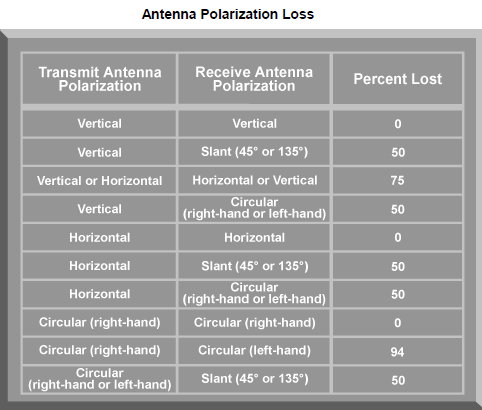
Radar horizon

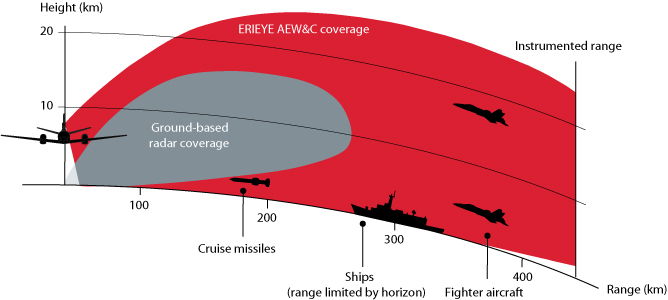
No matter what type of scan a radar system employs, terrain can limit radar line of sight (LOS) and target detection. The radar horizon is a critical area of performance for aircraft detection systems that is defined by the distance at which the radar beam rises enough above the Earth’s surface to make detection of a target at low level impossible in other words is the maximum range a radar system can detect a target due to the curvature of the earth. .It is important to remember that radio waves traveling in the atmosphere are bent, or refracted, and do not travel in a perfectly straight line. However, the degree of refraction depends on atmospheric conditions which vary significantly and are difficult to accurately quantify and predict. For these reasons, most radar computations are based on the assumption that radio waves travel in a straight line. The concept of the radar horizon is based on this assumption.(In formula below distance is measured in nautical miles (nm), and height is measured in feet )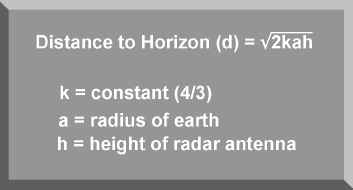
target altitude also plays an important role in maximum radar detection range due LOS

To increase radar horizon , the common method is to increase antenna height .

There is one exception to this rule, they are called Over the Horizon Radar (OTH) radar. Unlike regular radar which detects targets by sending and receiving radio directly at them almost in a straight line, over the horizon radar have to use “bend” their wave path to bypass the limitation of the earth curvature. There are two kind of OTH radar. They are:
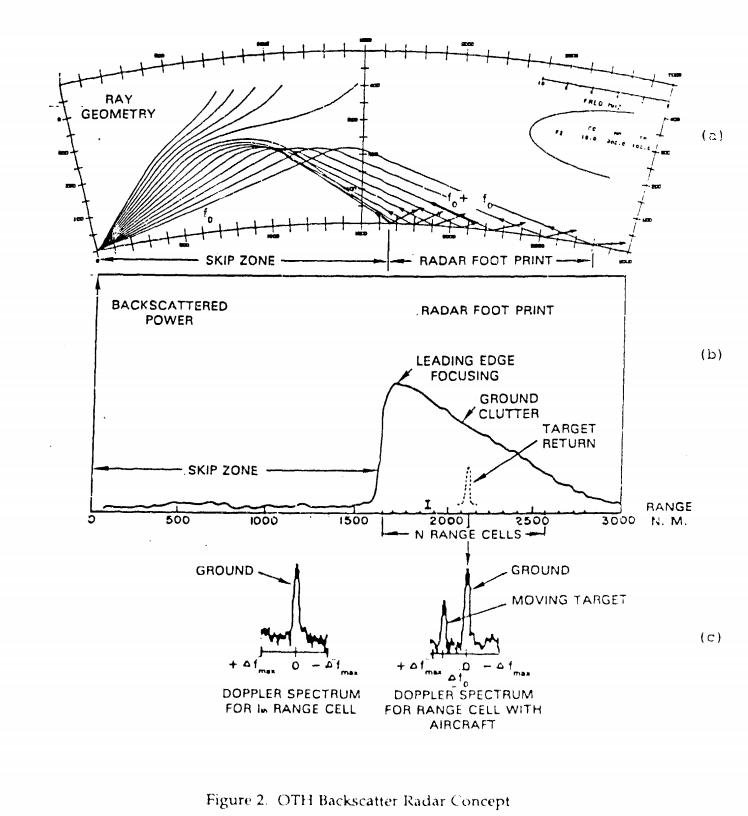
Skywave OTH radar (OTH-B)
OTH-B radar overcomes the earth curvature limitation by using very low frequency often between 5-28 Mhz and thus they are able to “bounce” (scatter) their wave off the ionosphere (the ionized layer at the top of the atmosphere).
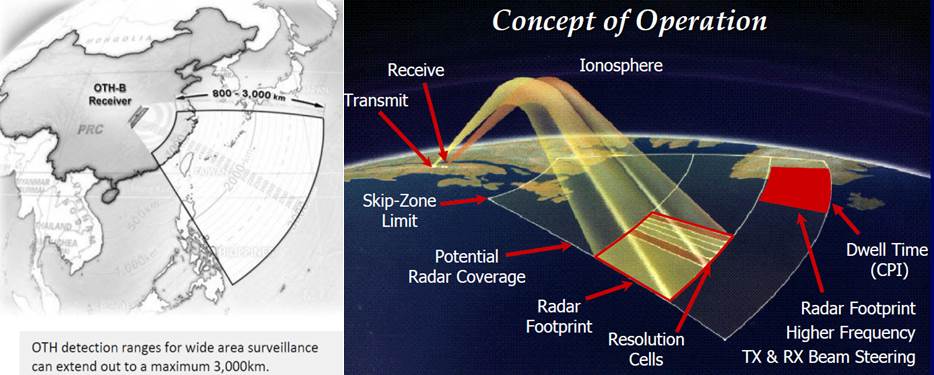
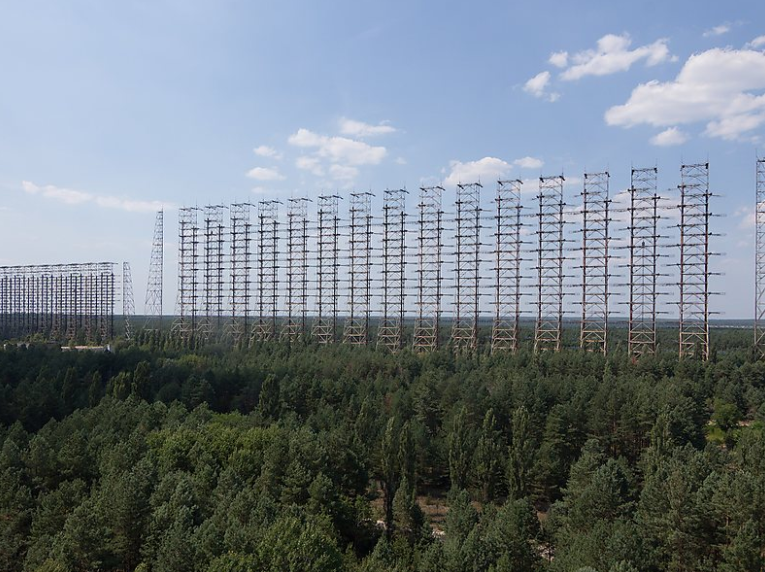
Thanks to that unique design, OTH-B radar can detect aircraft thousands of kilometers away even if these aircraft fly at very low altitude. However, since OTH-B radar use very low frequency, they are not only highly inaccurate but also required antennas which are extremely large, the height of each individual antenna often as high as 15-20 meters while the whole radar array often between 2-3 km long. Furthermore, the receiving and transmitting array need to be separated and stationed around 150-200 km away from each other. Due to their extreme size, OTH radars are large and stationary targets
Moreover, as OTH-B radar need to bounce their wave back from the ionosphere and there is a limitation the approach angle for the wave to bounce back, hence, there is a large cone-shaped blind area in front of the radar where target can’t be detected, this area often called the skip zone. Skip zone of OTH-B radar is often 800-2700 km in length, as a result, OTH radar is only used for warning purpose
Surface/Ground wave radar (OTH-SW)
OTH-SW radars overcome the limitation of the earth curvature by using a very low transmission frequency from 1.6-3 Mhz (could be up to 20 Mhz). These electromagnetic waves tend to bend or “diffract” around edges or curves, they are coupled to the conductive ocean surface forming a “ground wave”. They can bend over the horizon and will follow the curvature of the earth. Despite the common “ground wave” radar name, OTH-SW can only be used at the shoreline since they require the conductive characteristic of the ocean.
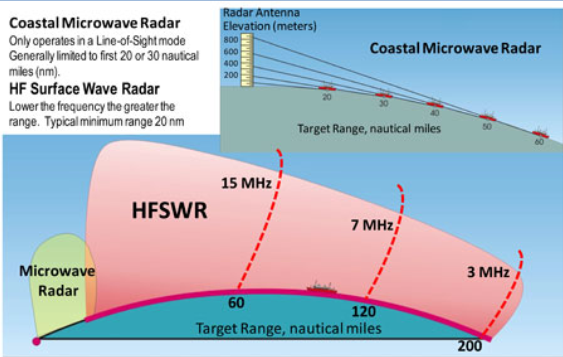
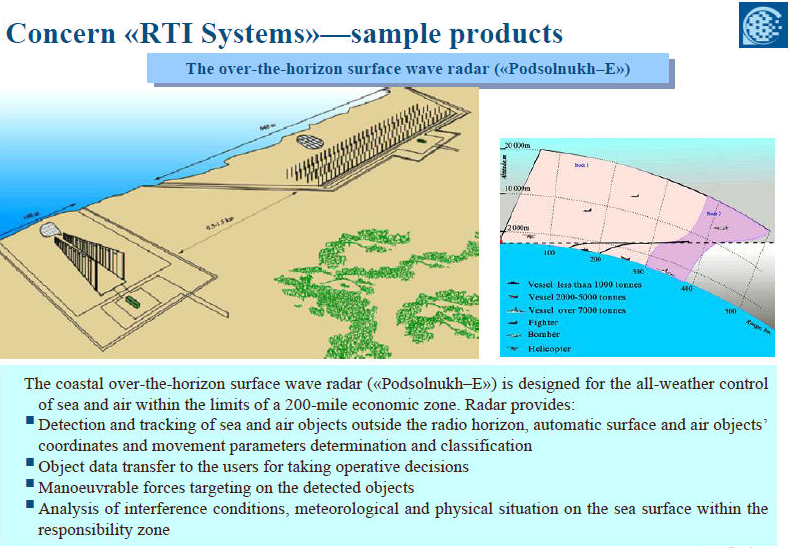
Similar to OTH-B radars, OTH-SW radar also requires large antennas for their operation and their accuracy is also very limited. However, OTH-SW radars don’t have the same skip zone limitation like OTH-B radar and their transmitting and receiving sub-array can be stationed very close to each other, only 1-2 km apart. On the other hand, OTH-SW radars range is far shorter than OTH-B radars, while OTH-B radars can detect targets from as far as 5500 km away, OTH-SW radars often top out at 300-350 km away.
Propagation
Propagation characteristics of radio energy are profoundly affected by the earth’s surface and atmospheric conditions. Any analysis of radar performance must take into account the propagation phenomena associated with radio frequency radiation in a “real world” environment. The most important propagation phenomena include refraction, anomalous propagation (ducting), and attenuation.
Refraction
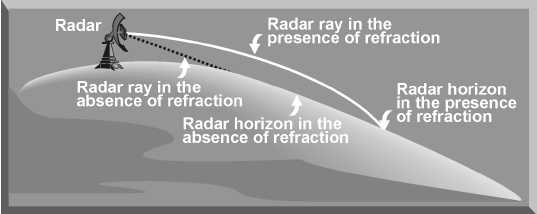
In a vacuum, radio waves travel in a straight line. However, radio waves propagating within the earth’s atmosphere do not travel in a straight line. The earth’s atmosphere bends, or refracts radio waves. One impact of the atmospheric refraction of radio waves is an increase in the line of sight (LOS) of the radar. This increase in radar LOS effectively extends the range of the radar system.

The refraction of RF waves in the atmosphere is caused by the variation in the velocity of propagation with altitude. The index of refraction (n) is used to describe this velocity variation and is defined by equation below

The term refractivity (N) is used for predicting the impact of refraction on RF wave propagation. Refractivity is a “scaled up” expression for the index of refraction and is used by radar designers to calculate the impact of refraction on actual radar systems. At normal radar operating frequencies, the refractivity for air containing water vapor can be computed using equation below
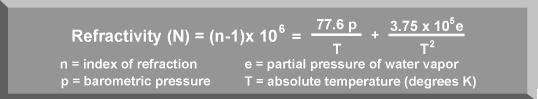
As altitude increases, the barometric pressure and water vapor content decrease rapidly. At the same time, the absolute temperature decreases slowly based on the standard lapse rate. Using equation above , it can be seen that the refractivity of the atmosphere decreases with increasing altitude. This decrease in refractivity means that the velocity of radio waves increases with altitude. The result is a downward bending, or refraction, of radio waves . Radio wave refraction primarily affects ground-based radar systems at low antenna elevation angles, especially at or near the horizon. Generally speaking, due to refraction increase the radar horizon of radar system over optical and infrared system by roughly 10-15%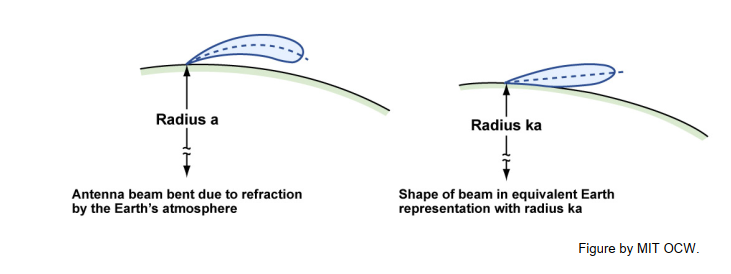
For most radar applications, refraction is not a factor at elevation angles above 5 degrees.
Anomalous Propagation
Non-standard or anomalous propagation occurs when the refractive index of the atmosphere is modified by changes in temperature gradient, pressure or water vapor content. These parameters can give rise to a wide range of non-standard propagation conditions.
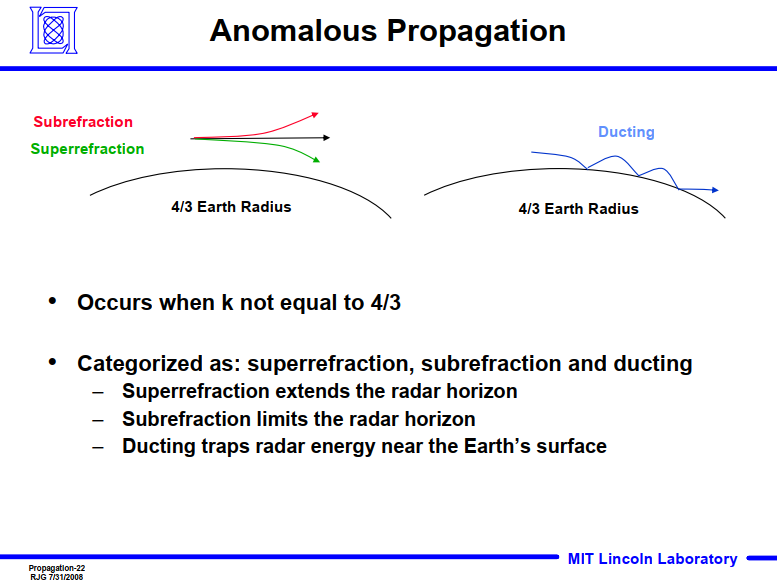
There are 3 types of anomalous propagation
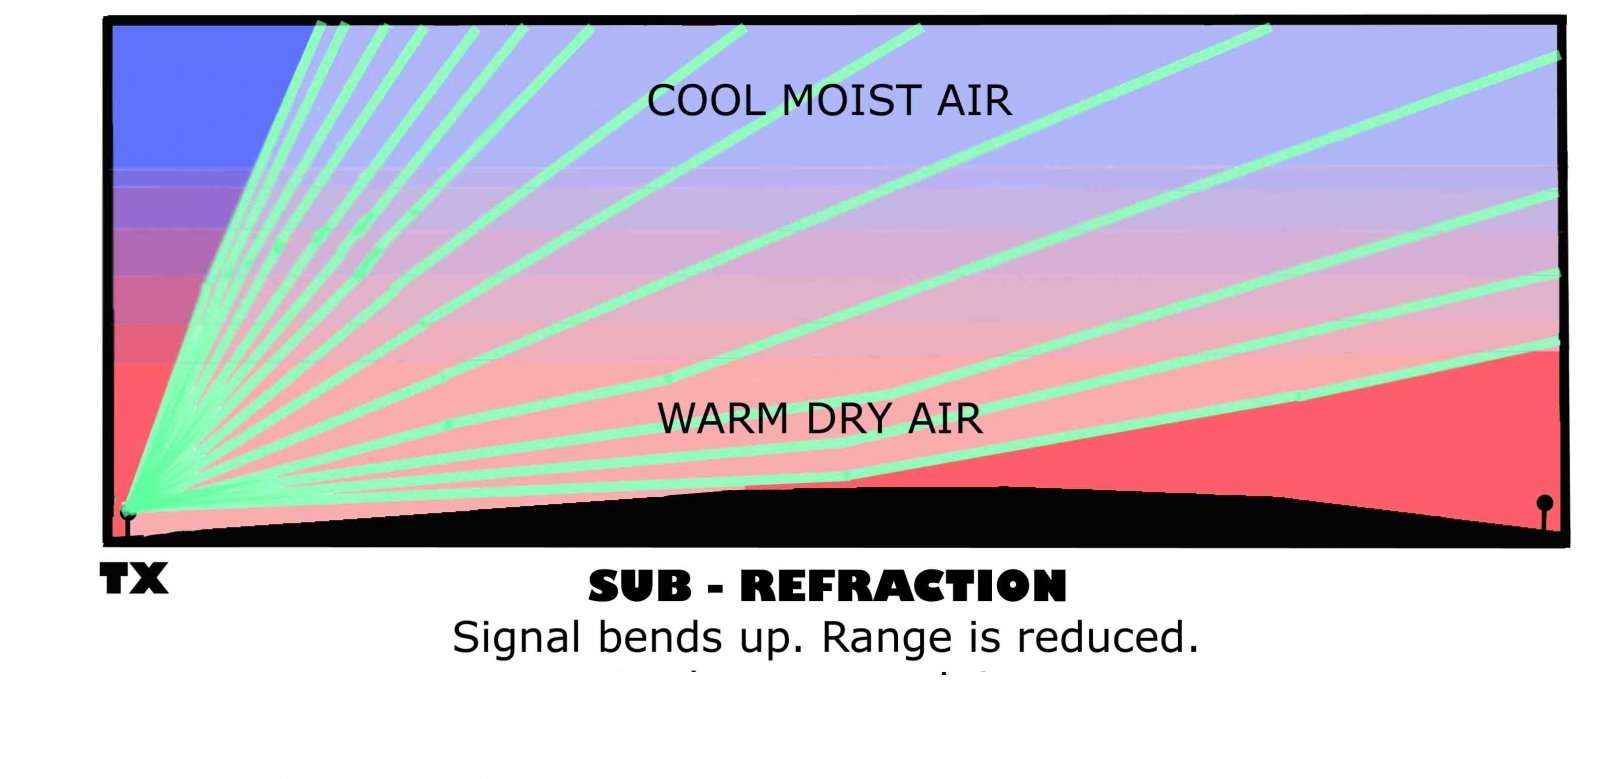
Sub-refraction: occurs when atmospheric conditions cause the radar beam to bend less than in the Standard Atmosphere, or bend upward. This happens when the atmosphere is unstable relative to the Standard Atmosphere. Sub-refraction causes the radar to overshoot targets that would ordinarily be observed under standard atmospheric conditions and results in a reduction in the radar horizon range of the radar. In addition to underestimated echo heights, this phenomenon tends to reduce ground clutter in the lowest elevation cuts. The classic situation under which sub-refraction occurs is the inverted-vee sounding, characterized by a dry-adiabatic or super adiabatic temperature lapse rate and a constant or increasing moisture supply with height. The near-surface air is typically dry. This situation is common over desert areas and on the lee side of mountain ranges, especially during the afternoon
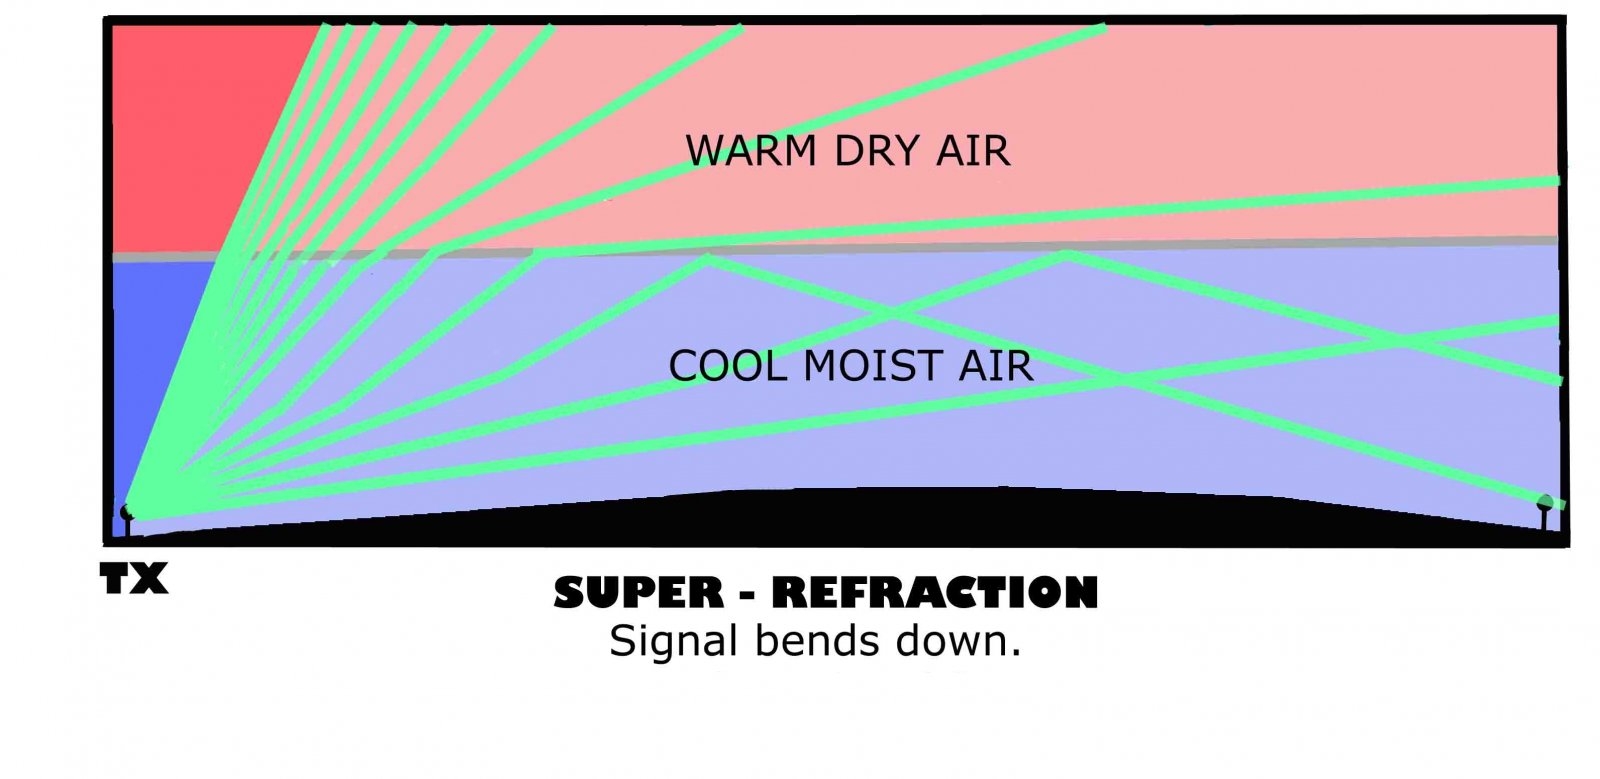
Super-refraction: occurs when atmospheric conditions cause the radar beam to bend more toward the surface of the earth than in the Standard Atmosphere, but not bend enough to hit the ground surface. This could help increase the radar horizon significantly. Super refraction effect formed when the refractivity of the atmosphere rapidly decreases with altitude. This occurs when the temperature increases with altitude and the water vapor content decrease with altitude. An increase in temperature with altitude is called a temperature inversion. This often happen when a flow of warm, dry air travel over a cooler surface; this is most effective if the cooler surface is water – due to mixing, lower layers of the atmosphere are cooled and moistened. It could also happen with the development of a sea breeze with cool moist air moving inland beneath a warm dry continental air mass. While helping extending the radar horizon, super-refraction effect results in overestimates of heights measured by radar. When super-refraction is occurring, a precipitation target is observed at a higher elevation angle than standard. Moreover, it can result in more range-folded echoes being detected because when super-refraction bends the radar beam, it can travel long distances and reflected off targets beyond the unambiguous range of the radar. Another unfavourable effect of super-refraction concerns the ability of the radar to detect non-precipitation targets at extended ranges. Ground clutter, a highly reflective echo pattern typically generated from terrain features and other objects close to the radar, will be expanded under super-refractive conditions. Surface features will be detected and displayed at extended ranges when the radar beam is bent enough to travel near the ground, or bounce along the ground, for a long distance. The usefulness of the radar is diminished because it is often difficult to distinguish ground return from precipitation targets.
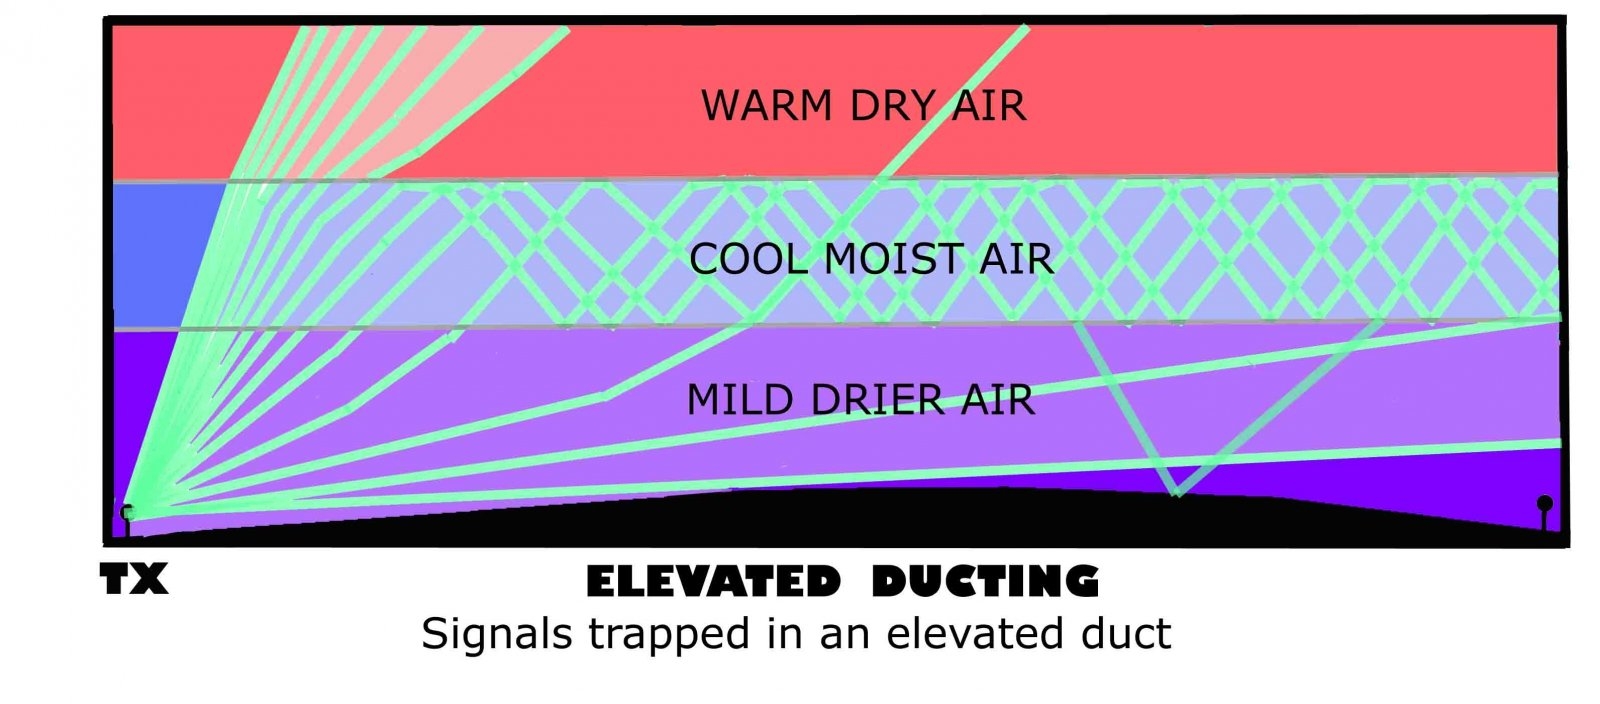
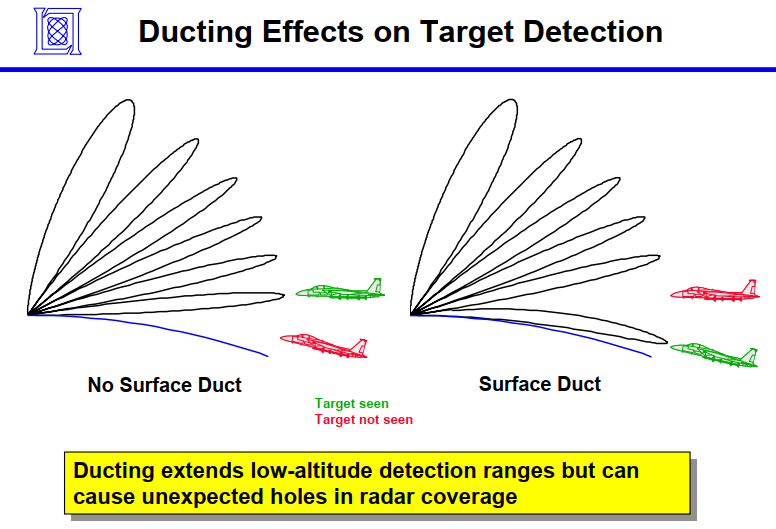
Ducting: is a unique form of super-refraction. To produce a duct, the temperature inversion must be very pronounced. A super refracting duct acts like a wave guide which traps the radio wave. This channels the radar signal and reduces attenuation. In order for the radio wave to propagate within a duct, the angle of the radar signal, in relation to the duct, should be less than one degree. The radio waves trapped by the duct take advantage of the decrease in refractivity and travel much further than normal. This can greatly extend the horizon of a radar system. The extension of radar range inside a duct can result in a reduction of radar coverage outside the duct. The area of reduced radar coverage because of ducting is called a radar hole. Due to radar holes, the extended radar range caused by ducting may result in a decrease in radar coverage along other paths of propagation. These holes can seriously degrade the effectiveness of early warning radar systems. For example, a radar system is taking advantage of a duct formed at the surface to extend low altitude radar range . Airborne targets flying just above the duct would normally be detected, but because of ducting, these targets may be missed. Water vapor content is a significant factor in producing ducts. Consequently, most ducts are formed over water and in warm climates.
Attenuation
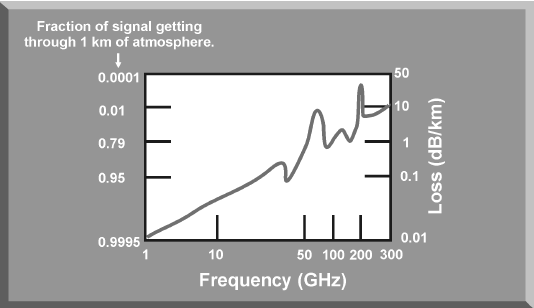
When traveling through atmosphere a portion of the radio wave energy strikes oxygen and water vapor and is absorbed as heat.The attenuation loss due to atmospheric gasses based on the frequency of the radio wave.At frequencies below 1 GHz, the effect of atmospheric attenuation is negligible. Above 10 GHz, atmospheric attenuation increases dramatically. This dramatic signal loss impacts the maximum detection range of radars operating in the millimeter wavelength band.Radio attenuation decreases as altitude increases. The attenuation experienced by an air-to-air radar will depend on the altitude of the target as well as target’s range. For a ground-based radar, attenuation will decrease as antenna elevation increases.

Multipath effect:
For ground based radar, the lower part of the radar beam will often reflected off the ground surface and interfered with the received signal.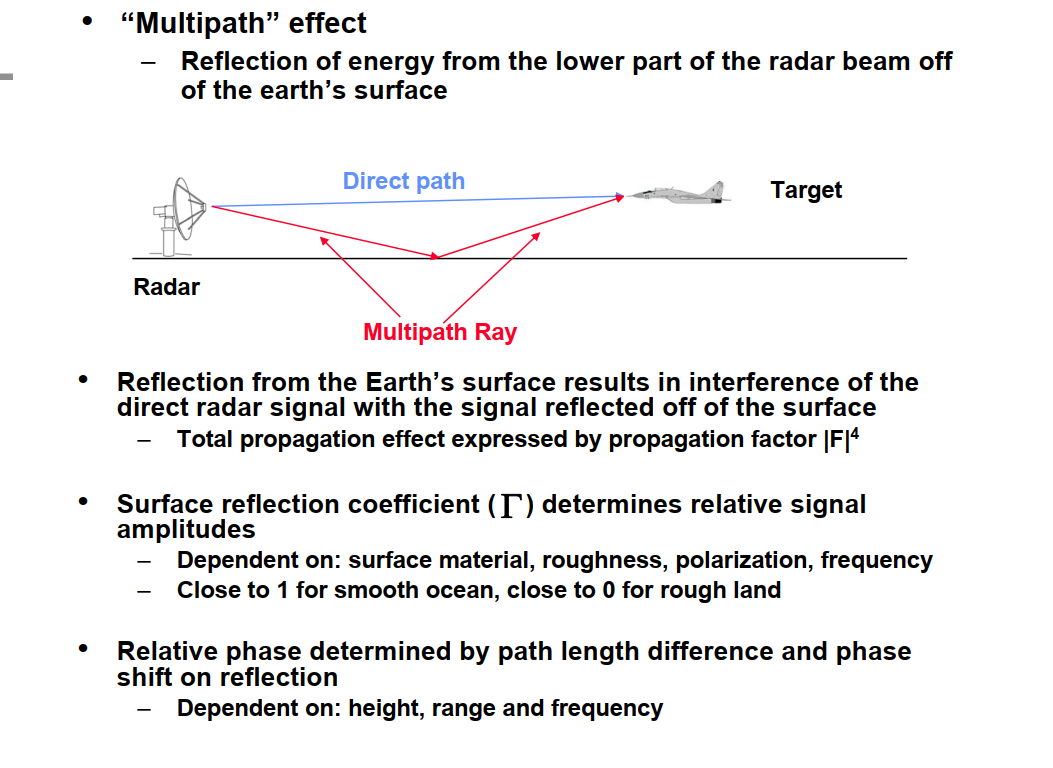
This interference can either be constructive (when it increase the amplitude of received signal) or destructive (when it reduce the amplitude of the received signal). One can think of this as natural born “active cancellation”
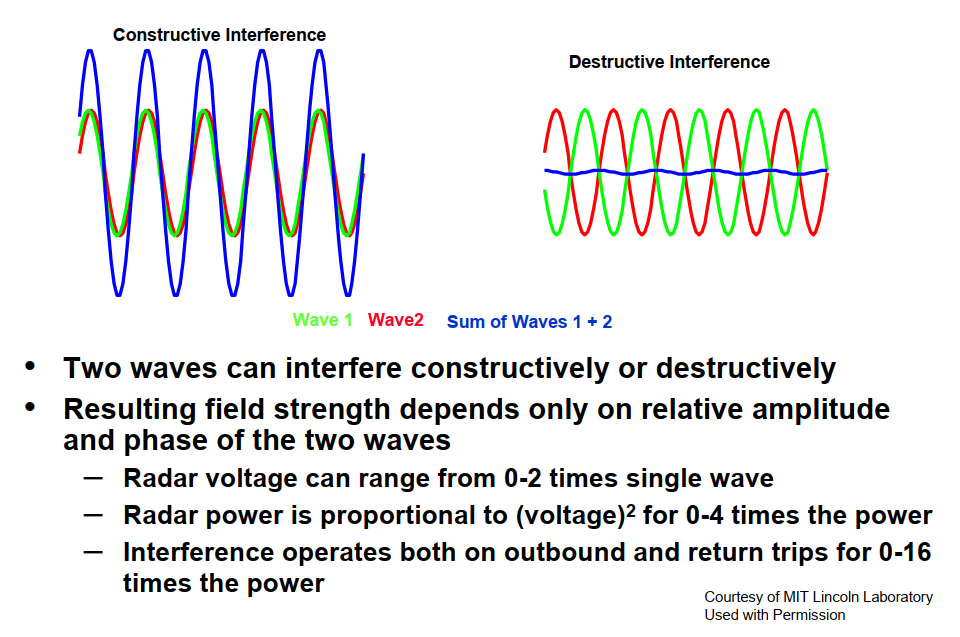
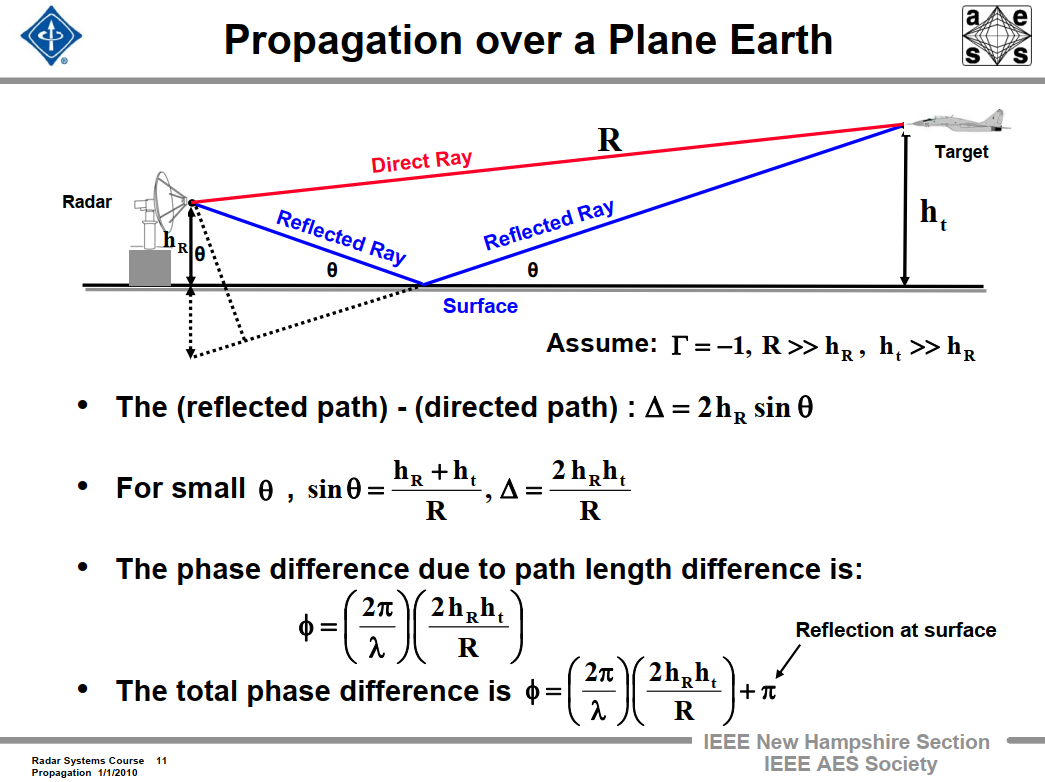
Whether the interaction is destructive or constructive will depend on the phase difference. The phase different will be affected by distance/target height/antenna height/glazing angle/frequency
How much the reflection from the surface affect the received signal will depend on a factor called the reflection coefficient. The higher the coefficient, the higher the amplitude of the reflection will be. Hence, it will affect the radar more. Generally, flat ground surface and flat sea have high reflection coefficient while rough sea and especially rough ground will have very low reflection coefficient. As a result, multipath effect affect ship radar a lot more than ground radar

The interaction of multipath effect will cause the radar coverage to break into multiple small lobes unlike the bubble coverage often seen in advertising video. At the peak of the lobe, the detection range can be as high as twice the normal free space value. By contrast, at the null, the detection range can be as low as zero.
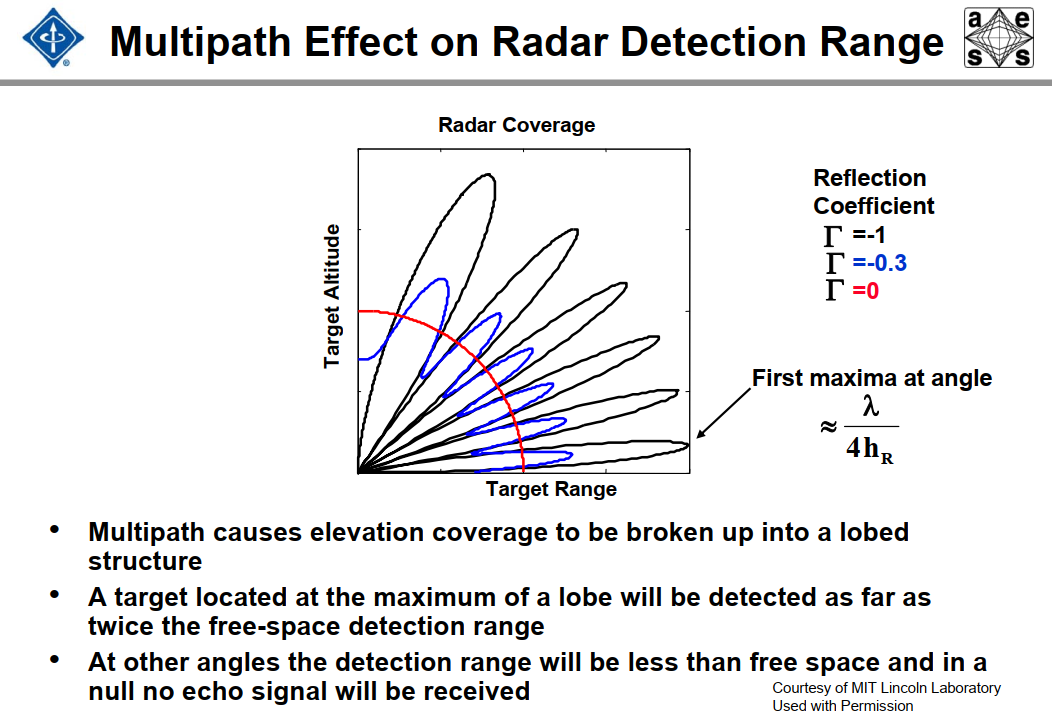
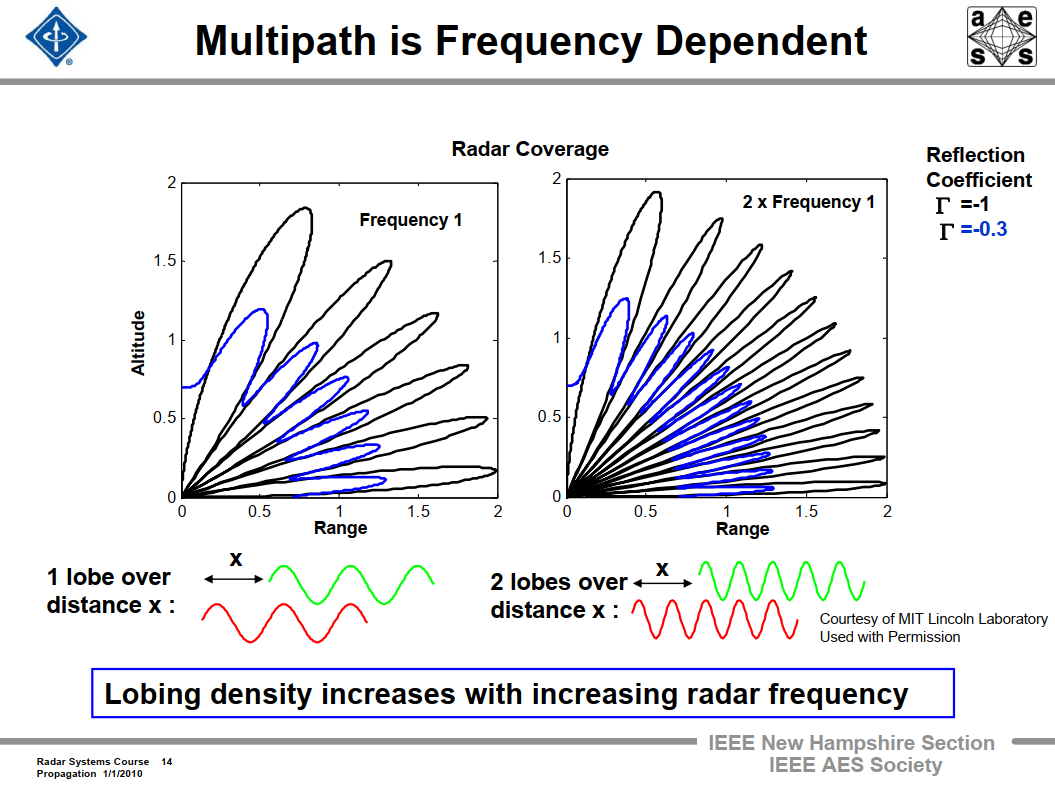
Low frequencies radars will suffered more from the multipath effect, because the distance between their lobes and nulls are far apart, leading to blind regions

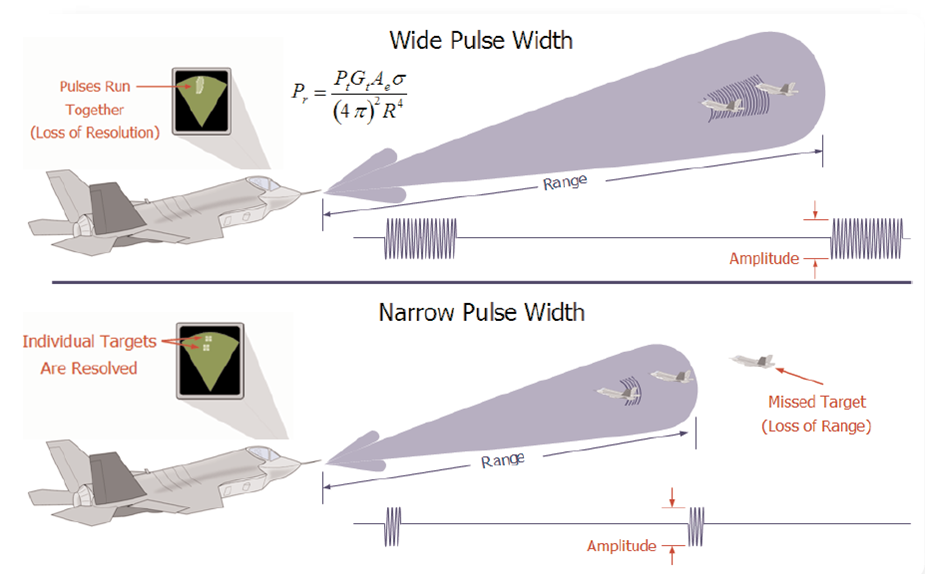
Pulse width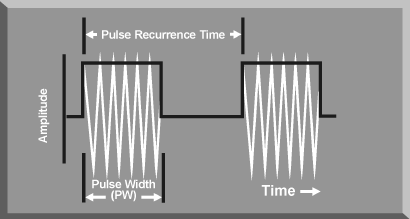
Pulse width (PW ) also known as pulse duration (PD), is the time that the transmitter is sending out RF energy. Pulse width is measured in microseconds. It has an impact on range resolution capability, that is, how accurately the radar can discriminate between two targets based on range.Range resolution is at best one-half the distance that the pulse travels in a time equal to the pulse width. This limitation is imposed by nature
Pulse recurrence interval/time (PRI/PRT)
Pulse recurrence time is the time elapsing between the start of one transmitted pulse and the next pulse; the reciprocal of the pulse repetition rate.
Pulse repetition frequency (PRF)

The pulse repetition frequency (PRF) is the number of pulses of a repeating signal in a specific time unit, normally measured in pulses per second and is expressed in hertz (Hz).PRF and PRI are related in that PRI is the inverse of PRF.It is important to note that operating frequency of the radar is not the same as pulse repetition frequency even though both are measured in Hz, They are entirely different characteristics of a pulsed radar signal.A radar computes range to a target by measuring the elapsed time between pulse transmittal and target return reception. For unambiguous range measurements, no more than one pulse should be received from the target for each pulse transmitted by the radar. Thus, the maximum required range of the radar determines the maximum repetition frequency of the radar.
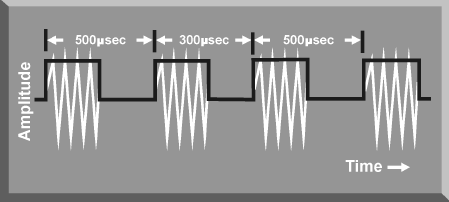
Stagger
Several adaptive measures may be assumed by a radar to lessen its susceptibility to ECM; one which will make the job of a deceptive jammer more difficult is the incorporation of staggered pulse trains.PRF stagger is accomplished by assuring that no adjacent PRIs are equal.The number of different PRIs generated is called the “position” of the stagger. Two-position stagger would have two PRI values, for example, 300 microseconds and 500 microseconds as illustrated in picture
The PRF of the radar is the sum of all the pulse trains so that if an RWR operated on PRF, the additional identification inherent in the stagger pattern would not be useful. This problem is overcome by measuring PRI rather than PRF so that the RWR measures the basic PRI a number of times equal to the number of stagger levels.
PFI Jitter

PRI jitter may be considered a random stagger. It is also a technique to counter deceptive jammers. PRI jitter has no repeating pattern of PRI values, the time between successive pulses is allowed to vary in a totally random manner over a series of set intervals as long as the maximum range condition is met, in theory, this allows an infinite number of PRI patterns to be generated.
Radar Detection Range
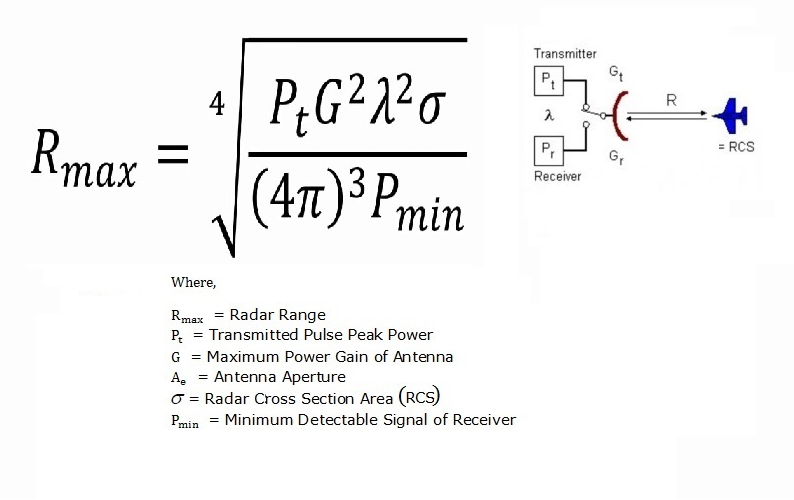
When discussing about aircraft and modern avionics, especially stealth aircraft like F-22, modern jammers like ALQ-99 or modern surface to air missiles systems such as S-300/400, many enthusiasts have inaccurate assumption that radar detection, tracking is a binary quality ( either they assume that radar will always detect the aircraft or the aircraft is completely invisible ).That assumption is inaccurate, however.Regardless of the systems involves, radar detection is a quantity characteristic that affected by factors such as radar peak power, pulse repetition frequency, target’s radar cross section, radar gain and so on.Radar detection range can be estimated by the equation above.
Radar Cross Section
Radar cross section is not the same as the area of the target even though square meters unit is often used to measure radar cross section (another unit that can be used to measure RCS is dBsm ).Radar cross section is the measure of a target’s ability to reflect radar signals in the direction of the radar receiver. In others words, it is a measure of the ratio of backscatter power per steradian (unit solid angle) in the direction of the radar (from the target) to the power density that is intercepted by the target.The conceptual definition of RCS includes the fact that not all of the radiated energy falls on the target.

- Projected cross section:
The geometric cross section refers to the area the target presents to the radar, or its projected area. This area will vary depending on the angle, or aspect, the target presents to the radar. In other words, the target will probably present the smallest projected area to a radar if it is flying directly toward the radar and is viewed head-on. A view from the side, top, or underneath will present a much larger projected area. - Reflectivity:
.Radar power does not necessarily reflect equally from all parts of an aircraft, and some components produce stronger radar reflections than others. In addition, some radar power is usually absorbed by the target. This absorption is especially true of aircraft coated with special substances called Radar Absorbent Materials (RAM) or those using internal reflectors called Radar Absorbent Structures (RAS) that trap incoming radar waves.Reflectivity refers to the fraction of the intercepted power that is reflected by the target, regardless of direction - Directivity:
Radar energy is not reflected evenly, depending on exact target’s shape radar wave will reflect toward some direction more than the others.The power that is reflected toward the radar is called the backscattered power. Directivity is defined as the ratio of the power that is backscattered in the direction of the radar to the power that would have been scattered in that direction if the scattering were in fact uniform in all directions
Radar cross section of simple metal shape can be estimated by the equation in table below (The variable λ represents the wavelength of the radar, which is assumed to be smaller than the dimensions of the shape.)
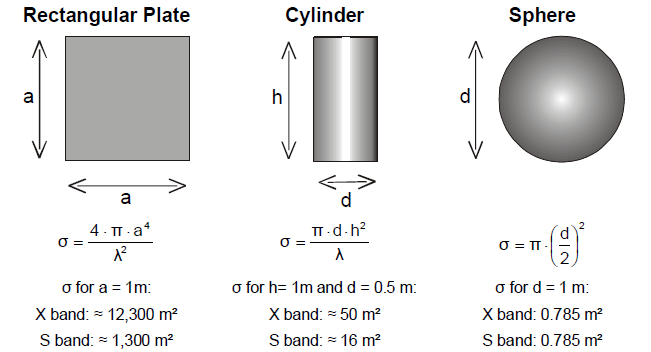
Unlike a sphere or a cylinder, an aircraft is a very complex target. It has a great many reflecting elements and shapes. For such targets there are no firm relationship between a target’s surface and RCS. Hence, aircraft radar cross section must be measured because it varies significantly depending upon the direction of the illuminating radar.
Example: simulated radar cross section of a Mig-29 as a function of aspect angle.

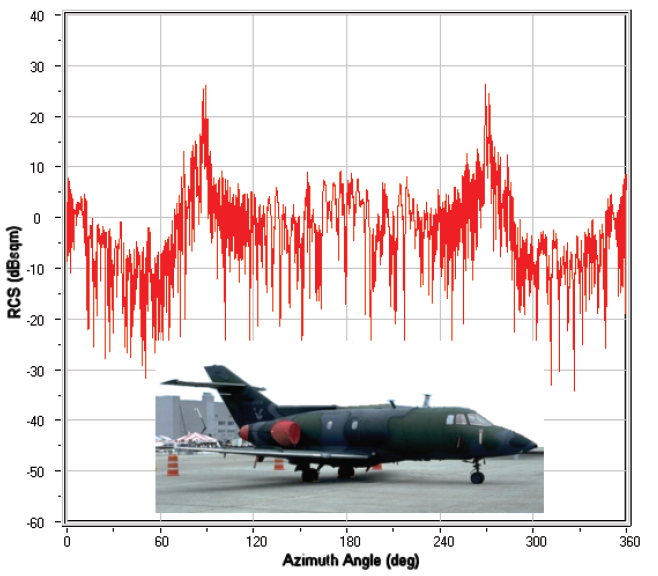
Example 2: Radar cross section of a C-29 cargo plane as a function of aspect angle
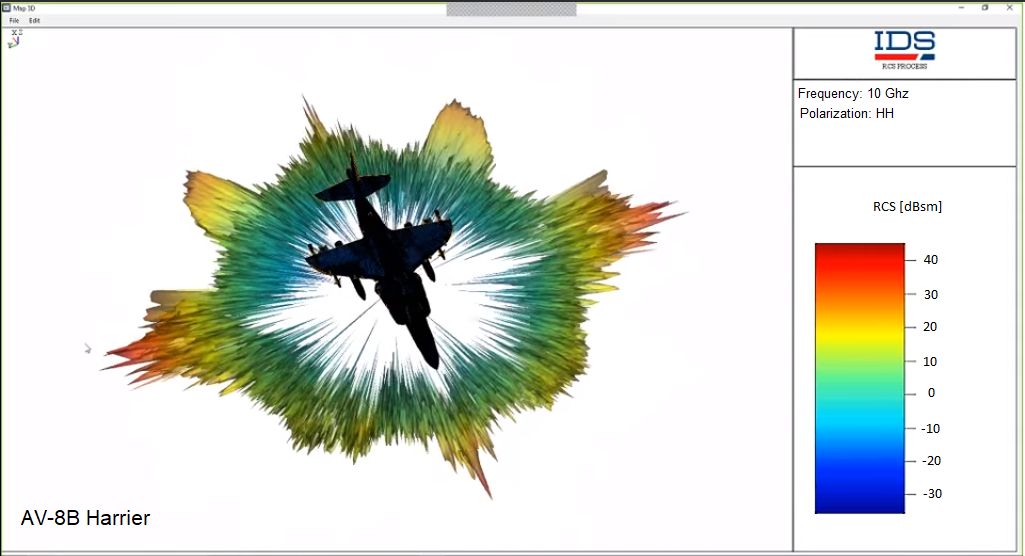
Example 3: Radar cross section of AV-8B Harrier as a function of aspect angle
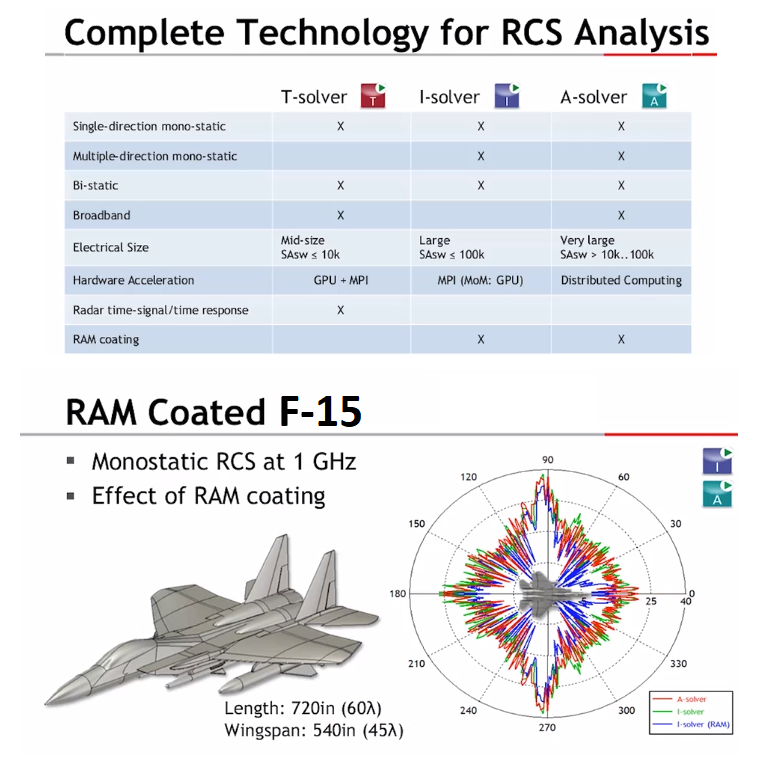
Example 4: Radar cross section of F-15 Eagle with and without RAM
Example 5: Radar cross section of AH-64 Apache with and without RAM

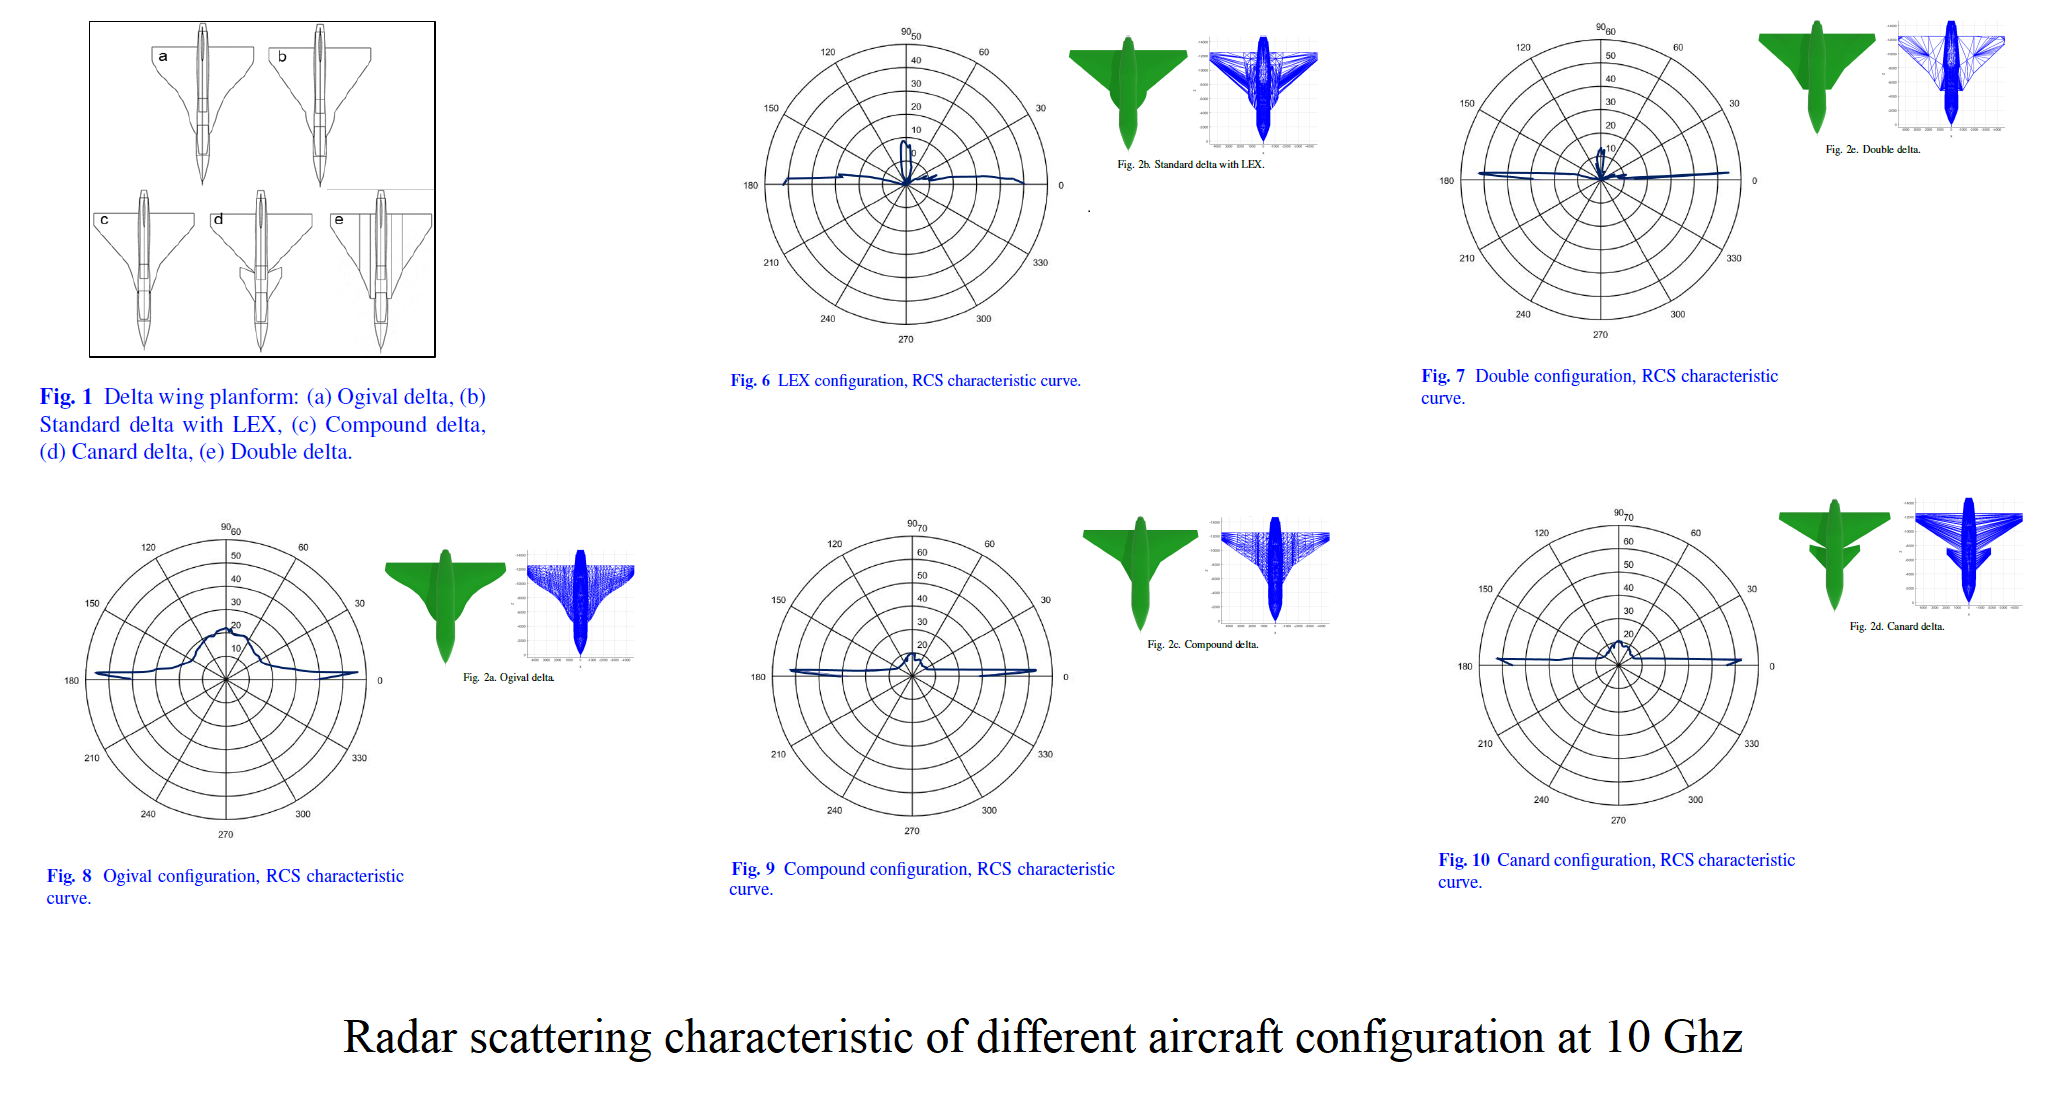
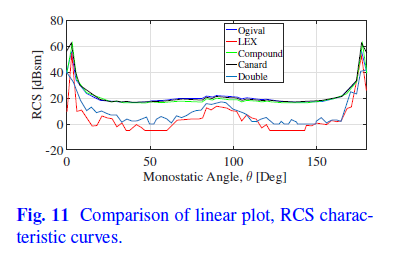
Example 6: Radar scattering characteristic variation based on aircraft configuration
The RCS of military ground and sea-based vehicles are often larger than that of military aircraft because the latter are generally more rounded for aerodynamic reasons while ground, sea vehicles are often made up of flat armor plates and lots of brackets, antennas etc.

Example: Radar cross section of a Destroyer at 10 Ghz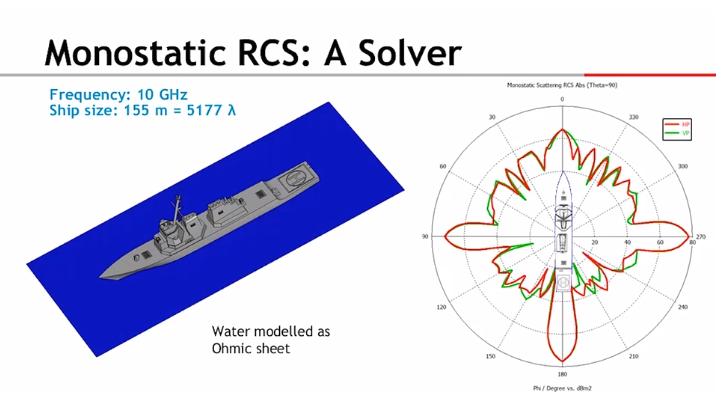
Aircraft can be designed to scatter over 99% of signal energy away from radar direction and absorb 99% of the rest, giving them much lower RCS.
Example : Simulated radar cross section of a stealth aircraft as a function of aspect angle.

- When reading “RCS as a function of aspect” charts, it is important to remember that bigger RCS value doesn’t always lead to higher detection distance if the aspect angle changed. The reason can be found here
An unique characteristic of a sphere is that it’s radar cross section is not affected by its orientation to the radar beam unlike others shapes such as cylinder or plate. As a result, aircraft’s RCS are often be compared to a sphere of a certain size.

The total radar reflection of a complex body such as aircraft made from several different kinds of reflections:
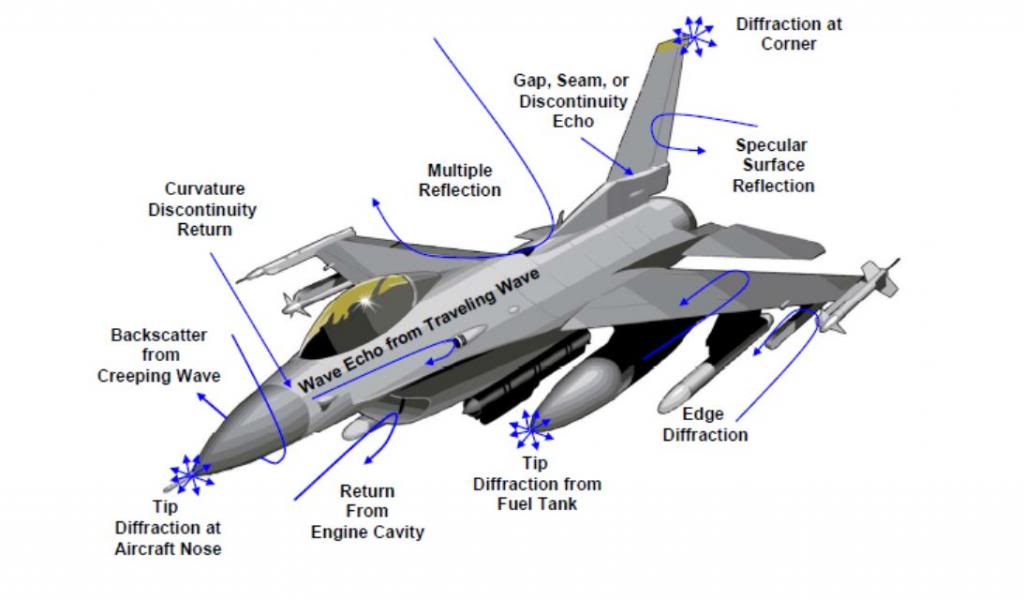
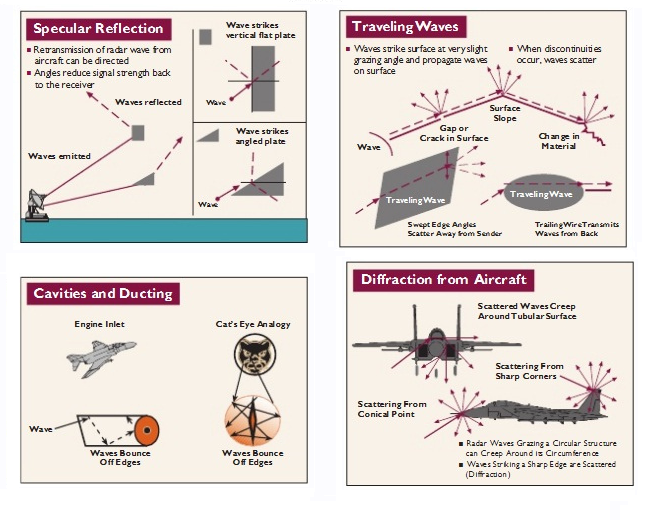
- Specular return: this is the most significant form of reflection in optical region (when structure size > 10 times wavelength) ,surface acts like a mirror for the incident radar pulse. Most of the incident radar energy is reflected according to the law of specular reflection ( the angle of reflection is equal to the angle of incidence).This kind of reflection can be reduced significantly by shaping
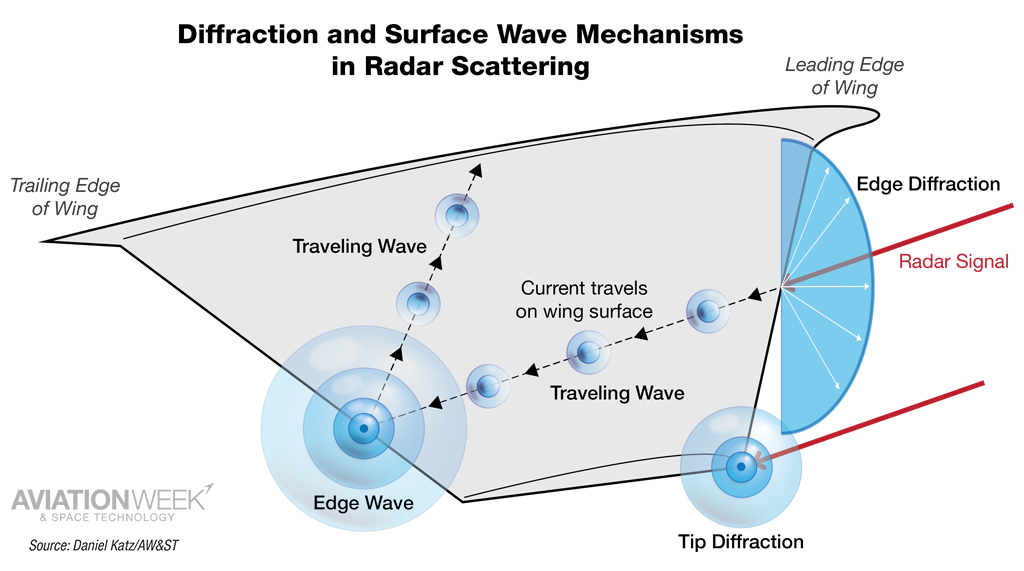
- Traveling/Surface wave return: an incident radar wave strike on the aircraft body can generate a traveling current on surface that propagates along a path to surface boundaries such as leading edge, surface discontinuous …etc, such surface boundaries can either cause a backward traveling wave or make the wave scattered in many directions .This kind of reflection can be reduced by radar absorbing material, radar absorbing structure, reduce surface gap or edges alignment ( so that their lobes occur in low priority region )
- Diffraction: wave striking a very sharp surface or edge are scattered instead of following law of spectacular reflection.
- Creeping wave return: this is a form of a traveling wave that doesn’t face surface discontinuous and not reflected by obstacle when traveling along object surface , thus it is able to travel around the object and come back at the radar. Unlike normal traveling wave, creeping wave traveled along surface shadowed from incidence wave (because it has to go around the object). As a result, the amplitude of creeping wave will reduce the further it has to travel because it can’t feed energy from the incident wave in the shadow region. Creeping wave mostly traveled around a curved or circular object. Hence, stealth fighters and stealth cruise missiles do not use tube fuselage. Nevertheless, the creeping wave return is much weaker than the specular return.
The percentage which each type of return will contribute to the total RCS value of an object depending on which region that object located in. The term region will be explained shortly.
A high-frequency regime (or optical region) applies when the circumference of the object is at least 10 times longer than the wavelength of the incident radar wave. In this regime, specular mechanisms dominate the radar reflection ,(the angle of reflection equals the angle of incidence), like billiard balls colliding. Reflection towards the emitting radar – is reduced by angling surfaces so that they are rarely perpendicular to radars and suppressing the reflections from re-entrant structures such as engine intakes and antenna cavities with combinations of internal shaping, radar-absorbent material (RAM) or frequency selective surfaces. In this regime, “surface wave” mechanisms are small contributors to RCS, but are still present. If the wavelength is small relative to the surface, these waves are weak and their overlap will generate maximum backscatter when the radar signal is at grazing angles. When these currents encounter discontinuities, such as the end of a surface, they abruptly change and emit “edge waves.” The waves from different edges interact constructively or destructively due to their phases. The result is that they can strengthen the reflection in the specular direction and create “sidelobes” – a fan of returns around the specular reflection which undulate rapidly and weaken as the angle deviates from the specular direction. Surface wave reflections are generally very small in the optical region.
Mie region or also known as the resonance region : applies when object circumference*0.1 ≤ radar wavelength ≤ object circumference*1 in this region the surface wave can also swing around a structure’s back side, becoming “creeping waves” that shed energy incrementally and contribute to backscatter when they swing back toward the threat radar. This creeping wave can interferes constructively or destructively with the specular backscatter to produce a variation in the object’s RCS. Creeping wave doesn’t follow mirror like reflection rule, thus the common angular shape of stealth aircraft doesn’t help deflect them away from the threat radar.

So why is stealth less effective at low frequency? As the radar wavelength of radar grows, the intensity of specular reflections is reduced but its lobes width are widened (the same phenomenon also happened to radar, if aperture size remained the same, the reduction in frequency will increase radar beamwidth). Because the specular reflection lobes are widen ,shaping become less effective because it will be harder to deflect radar wave away from the source ( it is important to note that, while this lobe widening phenomenon making shaping less effective, it also reduce the intensity of the reflection because the energy will be distributed over a wider volume )
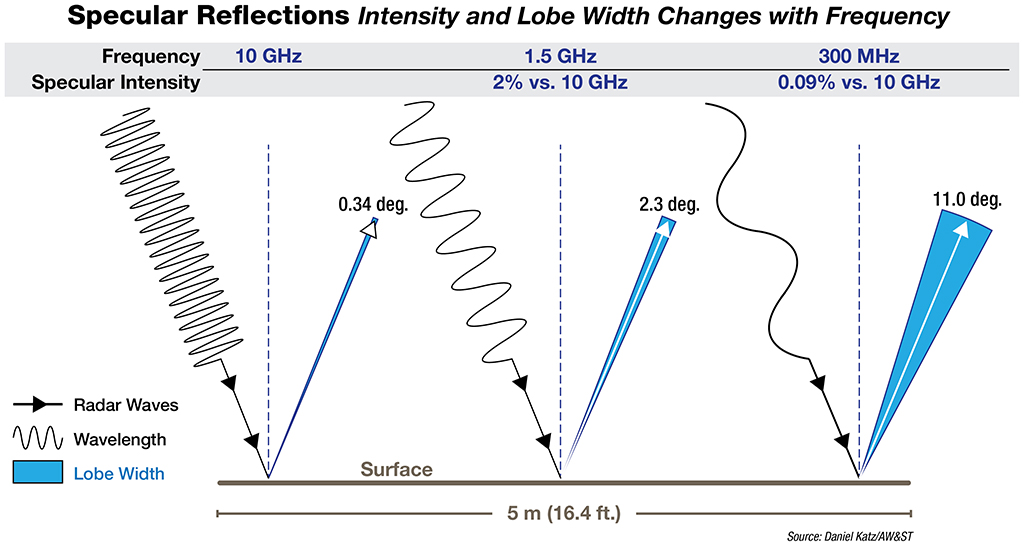
Specular reflections from flat surfaces decrease with the square of the wavelength but widen proportionally: at 1/10th the surface length(approaching Mie region) they are around 6 deg. wide.
At lower frequency, the effect of traveling wave and diffraction is also more pronoun. For flat surfaces, traveling waves grow with the square of wavelength and their angle of peak backscatter rises with the square root of wavelength: (at 1/10th the surface length, it is over 15 deg). As the power of surface wave grow, the power of creeping wave return also grow. Tip diffractions and edge waves from facets viewed diagonally also grow with the square of wavelength. The end result is that the net value of stealth aircraft’s RCS often increases in Mie region. Maximum RCS is often reached when the wavelength reaches the circumference of the structure
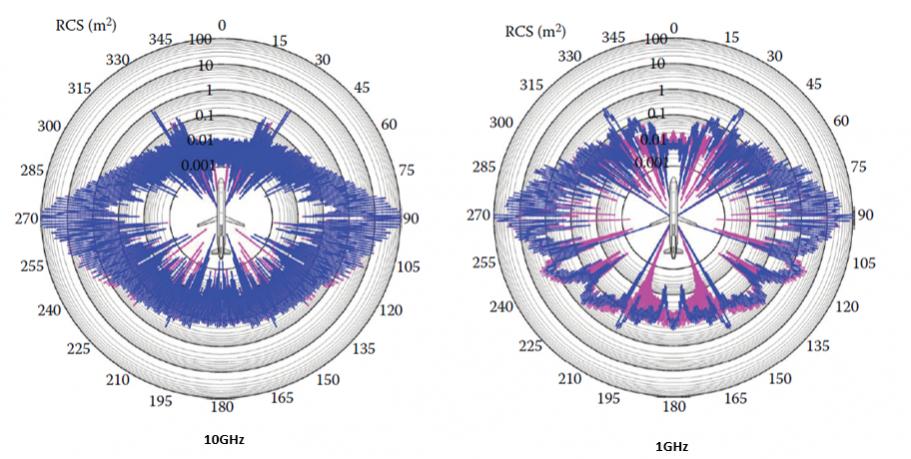
Example: Simulated radar cross-section of a B-2 aircraft and AGM-86 missiles as a function of aspect angle ( at 10 Ghz and 1 Ghz respectively )

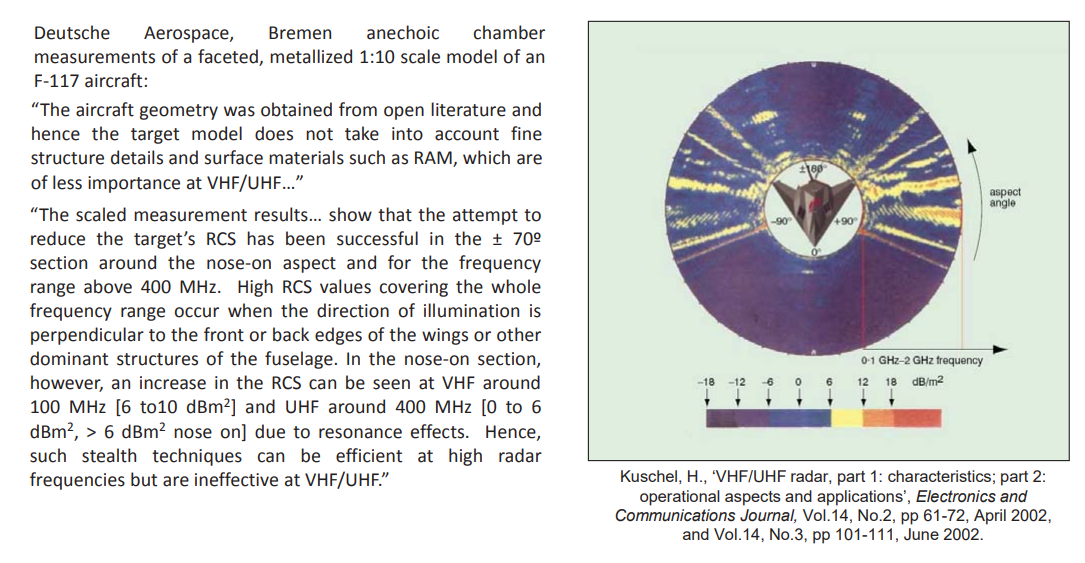
Example: anechoic chamber measurement of a metallic F-117 model at the frequency range from 0.1-2 GHz
There is a common misconception that any low-frequency radar can render stealth aircraft useless regardless of their transmitting power or aperture size (Ex: Tikhomirov NIIP L-band transmitter on the leading edge of Flanker series are often cited by enthusiasts as a counter stealth system) , that is wrong however. While it is true that stealth aircraft will often have higher RCS in Mie region. It is important to remember that given equal radar aperture area, lower frequency radars will have much wider beam compared to high-frequency radars, thus, the concentration of energy is much lower making them more vulnerable to jamming, lower gain also result in lower accuracy. Moreover, as mentioned earlier lower frequency also resulted in wider reflection beamwidth, hence weaker reflection. As a result, most low-frequency radars have much bigger transmitting antenna compared high-mid frequency radar (to get narrow beamwidth) ,it is also the reason that fighters fire control radar still work in X-band, because a L-band, VHF band radars of similar size would be too inaccurate for any purpose others than early warning.
So, is there any way for modern stealth aircraft to reduce their return even in Mie region?. The answer is YES
To begin with, the negative effect of traveling wave and diffraction can be reduced by: aligning discontinuities to direct traveling waves towards angles of unavoidable specular return, such as the wing leading edge, thus limit their impact at other angles.
Example: serrated edges are used in place where there is current discontinuity such as weapon bay door so that traveling wave return reflected toward less important angle

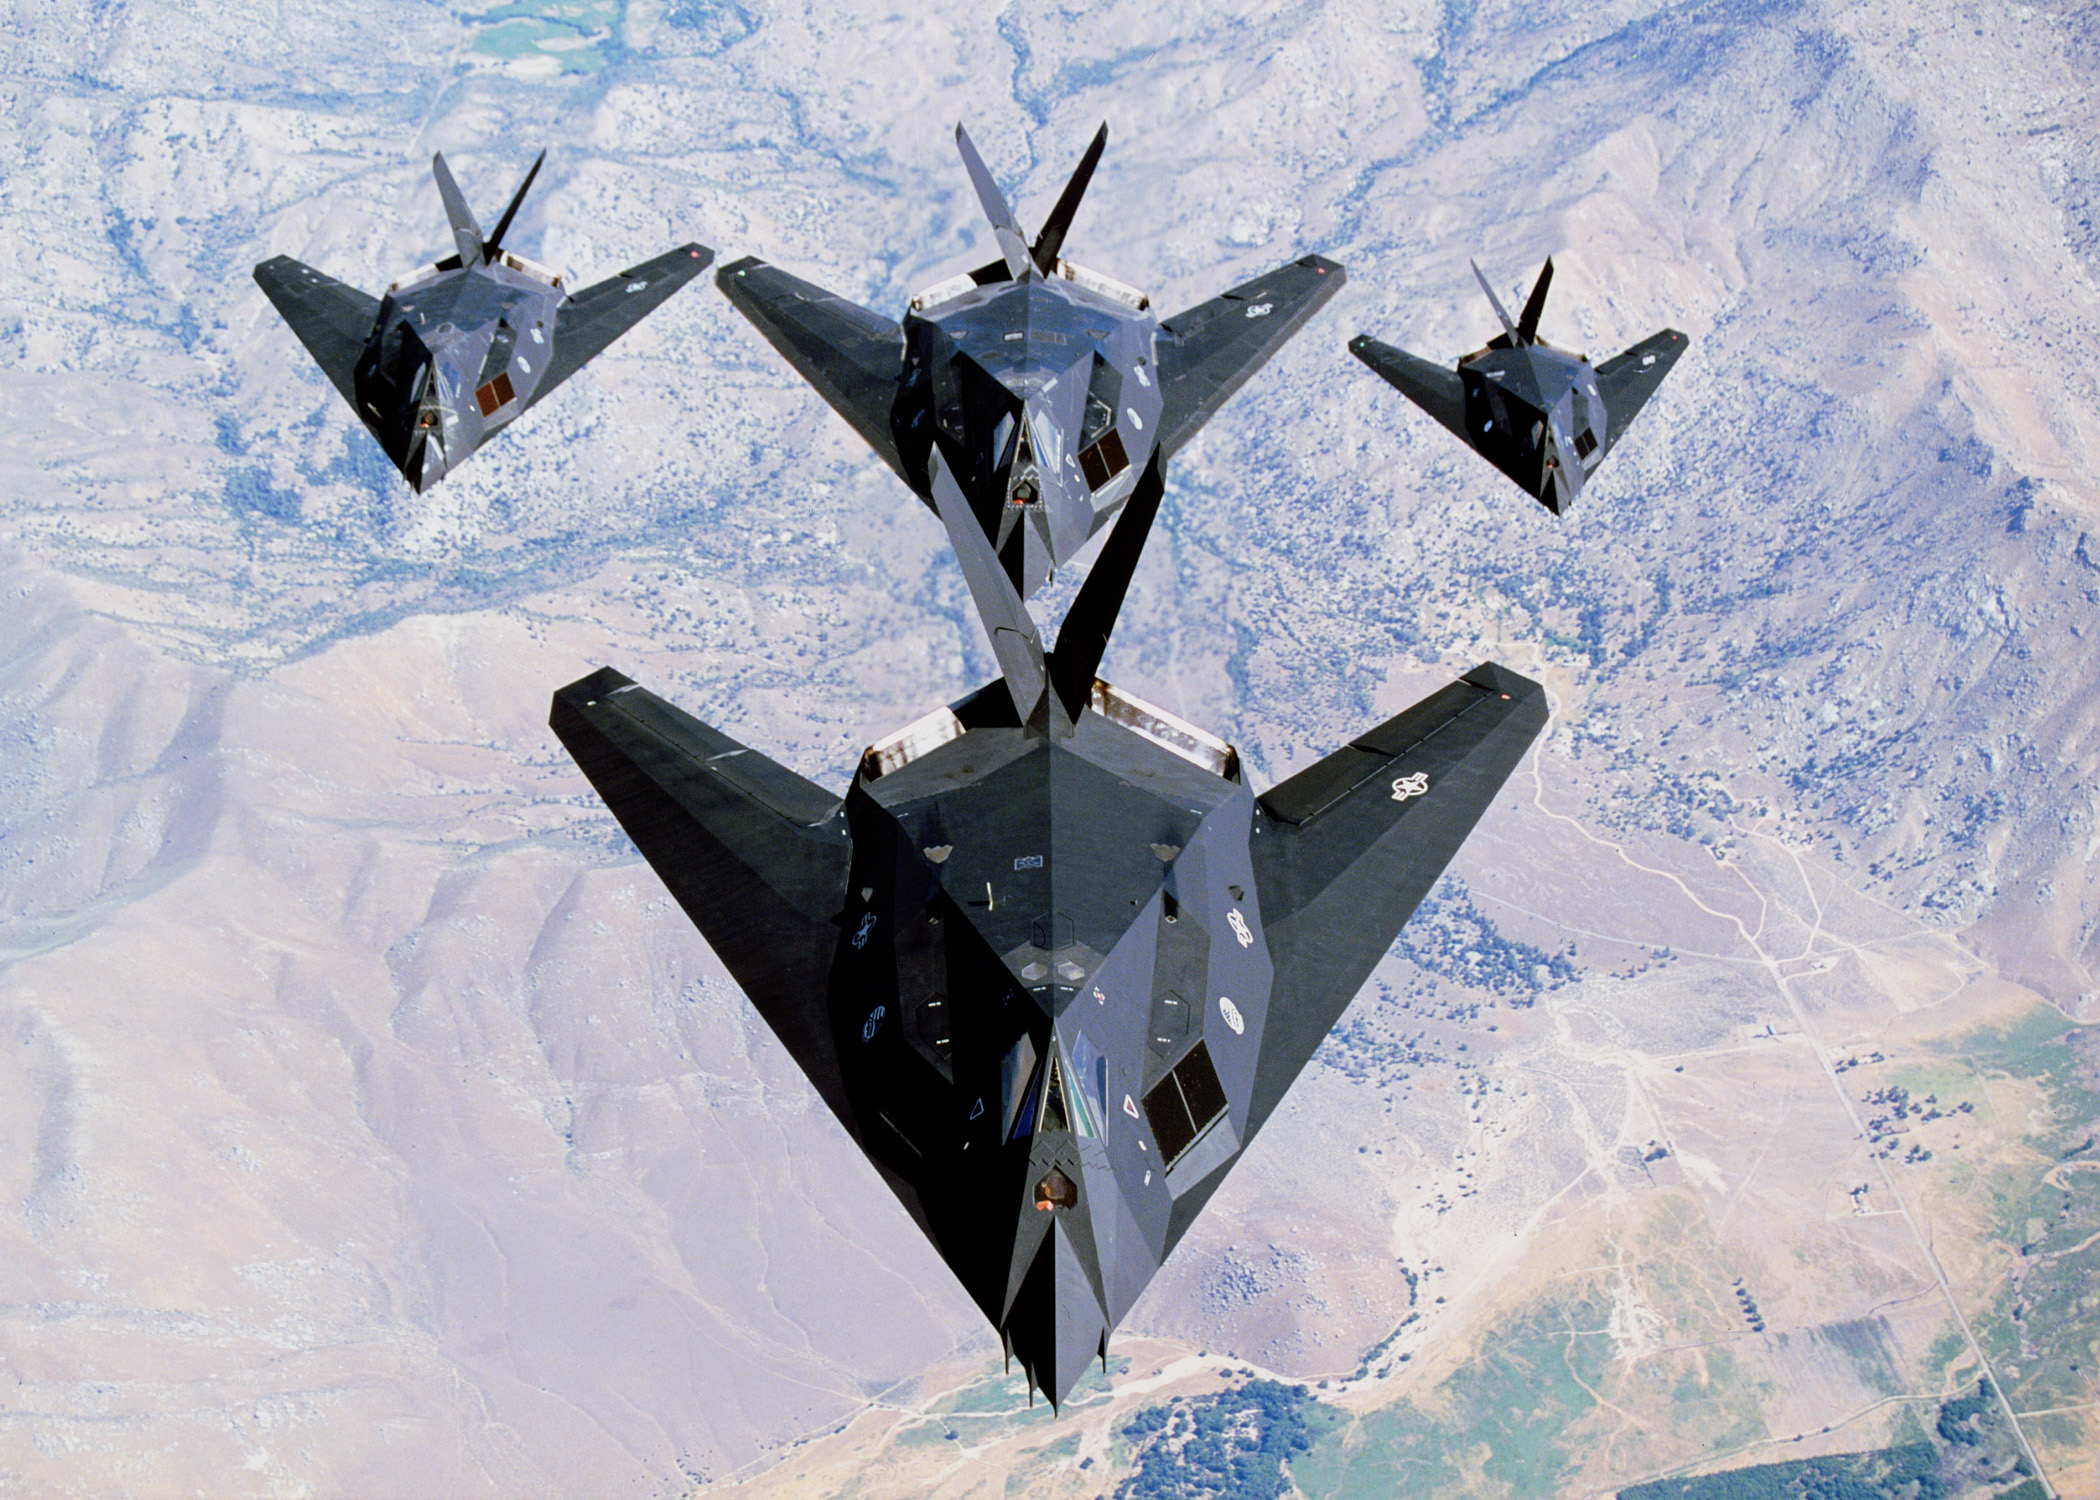
Another common method to reduce the effect of surface wave is designing airframe facets with non-perpendicular corners and so radars view them along their diagonals, at low angles and across from the facets’ smallest angles, limits the area of edge-wave emission. Surface wave diffraction can also be reduced by blending facets. The first stealth aircraft, the F-117, was designed with a computer program that could only predict reflections from flat surfaces, necessitating a fully faceted shape, but all later stealth aircraft such as B-2 , F-35 , F-22, X-47 use blended facets. Shapes composed of blended facets are not only more aerodynamic but also allow currents to smoothly transition at their edges, reducing surface-wave scattering. Therefore, blended bodies have the potential for a lower RCS than fully faceted structures, especially at low-frequency regime. And blending the curves around an aircraft in a precise mathematical manner can reduce RCS around the azimuth plane by an order of magnitude. The penalty is often a slight widening of the specular return at the curves, but in directions at which threat radars are less likely to be positioned. This was one of the great discoveries of the second generation of stealth technology.

Example: Air frame of first generation stealth aircraft such as F-117 are fully facet. Whereas second and third generation of stealth aircraft such as F-35, B-2, X-47 uses blended facet design where needed.

It is, however, important to remember that, even though a blended body shape can benefit stealth characteristics because they reduce surface scattering compared to sharp facet design. A full circular (tube) body is extremely bad for stealth application, the reason is that the surface wave doesn’t get scatter but will travel a full circle around the object and come back to the source (also known as creeping wave return).

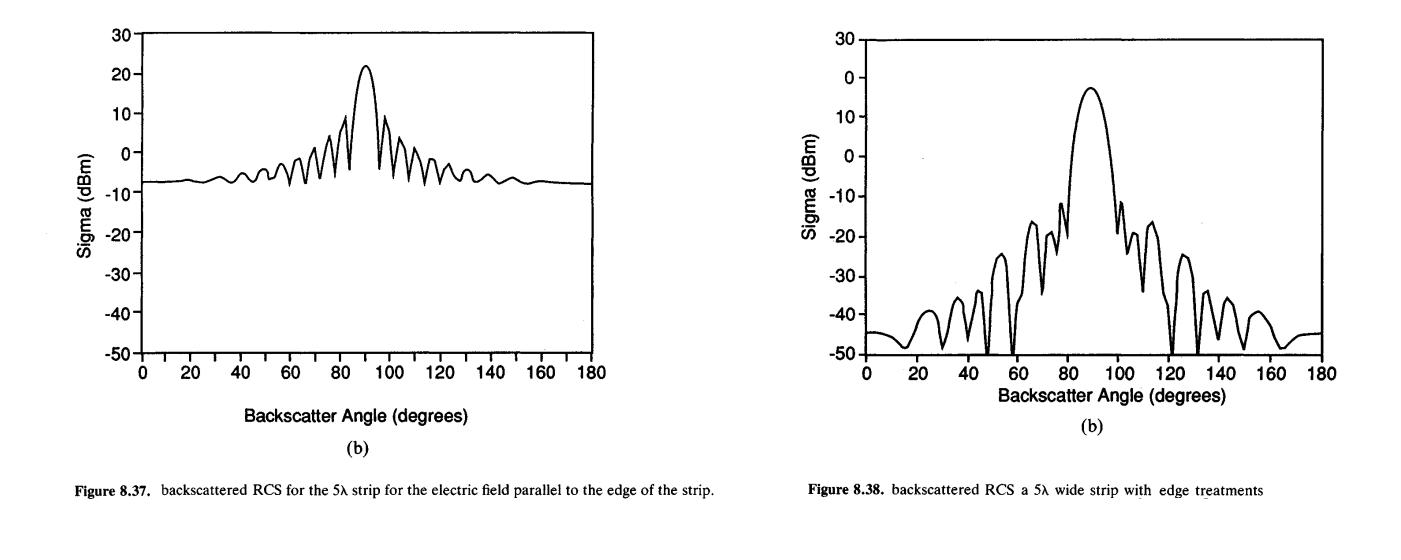
While it is possible to reduce the number of sharp edges with blended edge design, it is not possible to get rid of them all, for example an aircraft will always have wing and inlet edges. Thus, there are the need for trailing edge and leading edge treatment. As mentioned earlier, the edge diffraction is more pronoun at lower frequency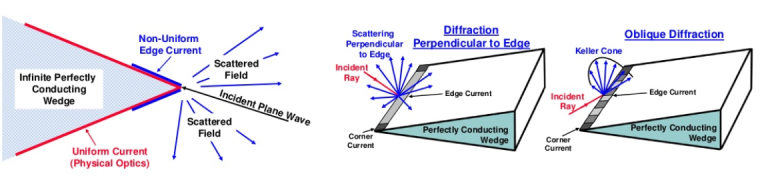 To reduce the effect of edge diffraction, the wing and inlet leading edge can be made to be a soft electromagnetic surface, this is done by using lightweight material such as glass fiber honeycomb loaded with carbon in a concentration increasing from tip to base.
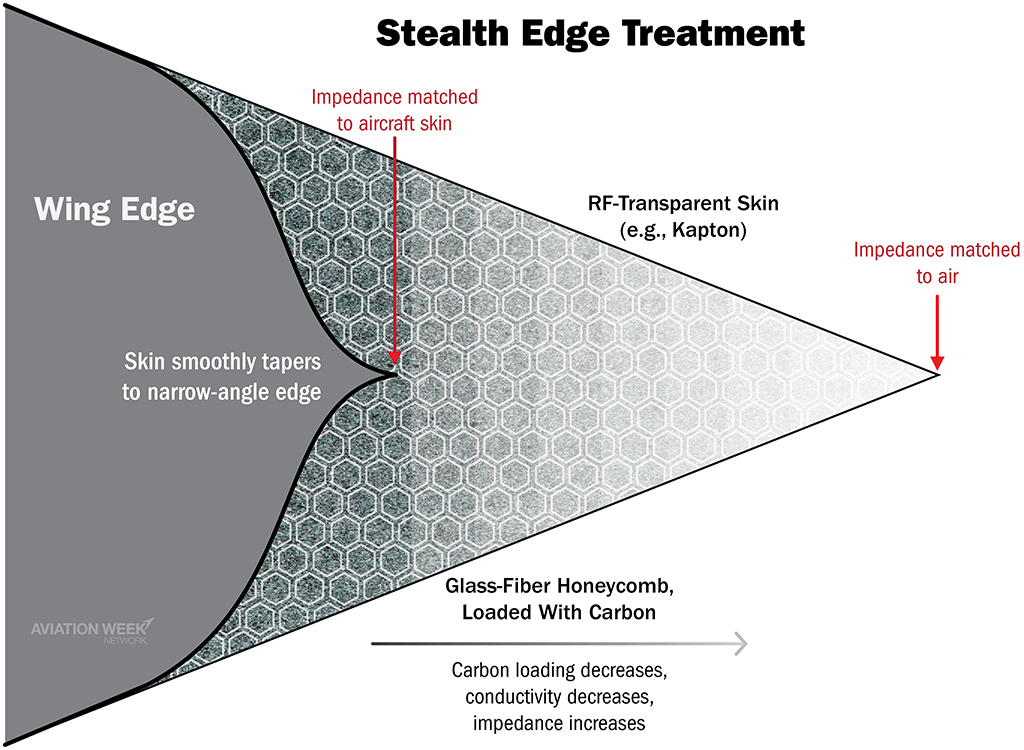
Alternatively, a tapered resistive sheet can be sticked or painted on the edge to achieve the same result. Additionally the edge can be made from bulk absorber to improve the result. Similar to the previous example, the resistivity of the sheet will reduce from the maximum at the front tip of the edge to near zero at the rear. The resistivity of the sheet can be increased by adding holes and reduce by adding metal particles in it.

This allows the surface current to transition slowly rather than abruptly as well as be absorbed and thus reduce the edge diffraction as well as surface wave
On the other hand, creeping wave return will be reduced by trailing edge treatment , a thin high resistance strip is often applied on the trailing edge to absorb the energy of the surface wave

As mentioned earlier, the resistive strip/tape must have a width at least half the wavelength of the lowest frequency of interest to be effective, so it is plausible to estimate the lowest frequency where the edge treatment can remain effective.
For example: the inlet edge strip/tape treatment of F-35 has width between 22- 25.4 cm, which would indicate the lowest frequency where the treatment can still be effective is around 0.5-0.7 GHz

Rayleigh Region applies when the circumference of the object is smaller than the radar wavelength. A common misconception is that the lower the operating frequency of the radar ( longer wavelength ), the better it would perform again stealth assets. That is wrong, however. It is important to remember that aircraft RCS does not necessarily grow linearly with increase in frequency. Once the radar wavelength grows past the target’s circumference, the specifics of target geometry cease to be important and only its general shape affects reflection. The radar wave is longer than the structure and pushes current from one side of it to the other as the field alternates, causing it to act like a dipole and emit electromagnetic waves in almost all directions. This phenomenon is known as Rayleigh scattering. At this point, the RCS for aircraft will then decrease with the fourth power of the wavelength and can get exponentially smaller as the frequency reduce.
.

One thing we must remember is that, aircraft are object with very complex shape with many components of different size, thus, even in one specific wavelength, we often found that some parts of the aircraft could be in Rayleigh region, some in Mie region and the rest in optical region.
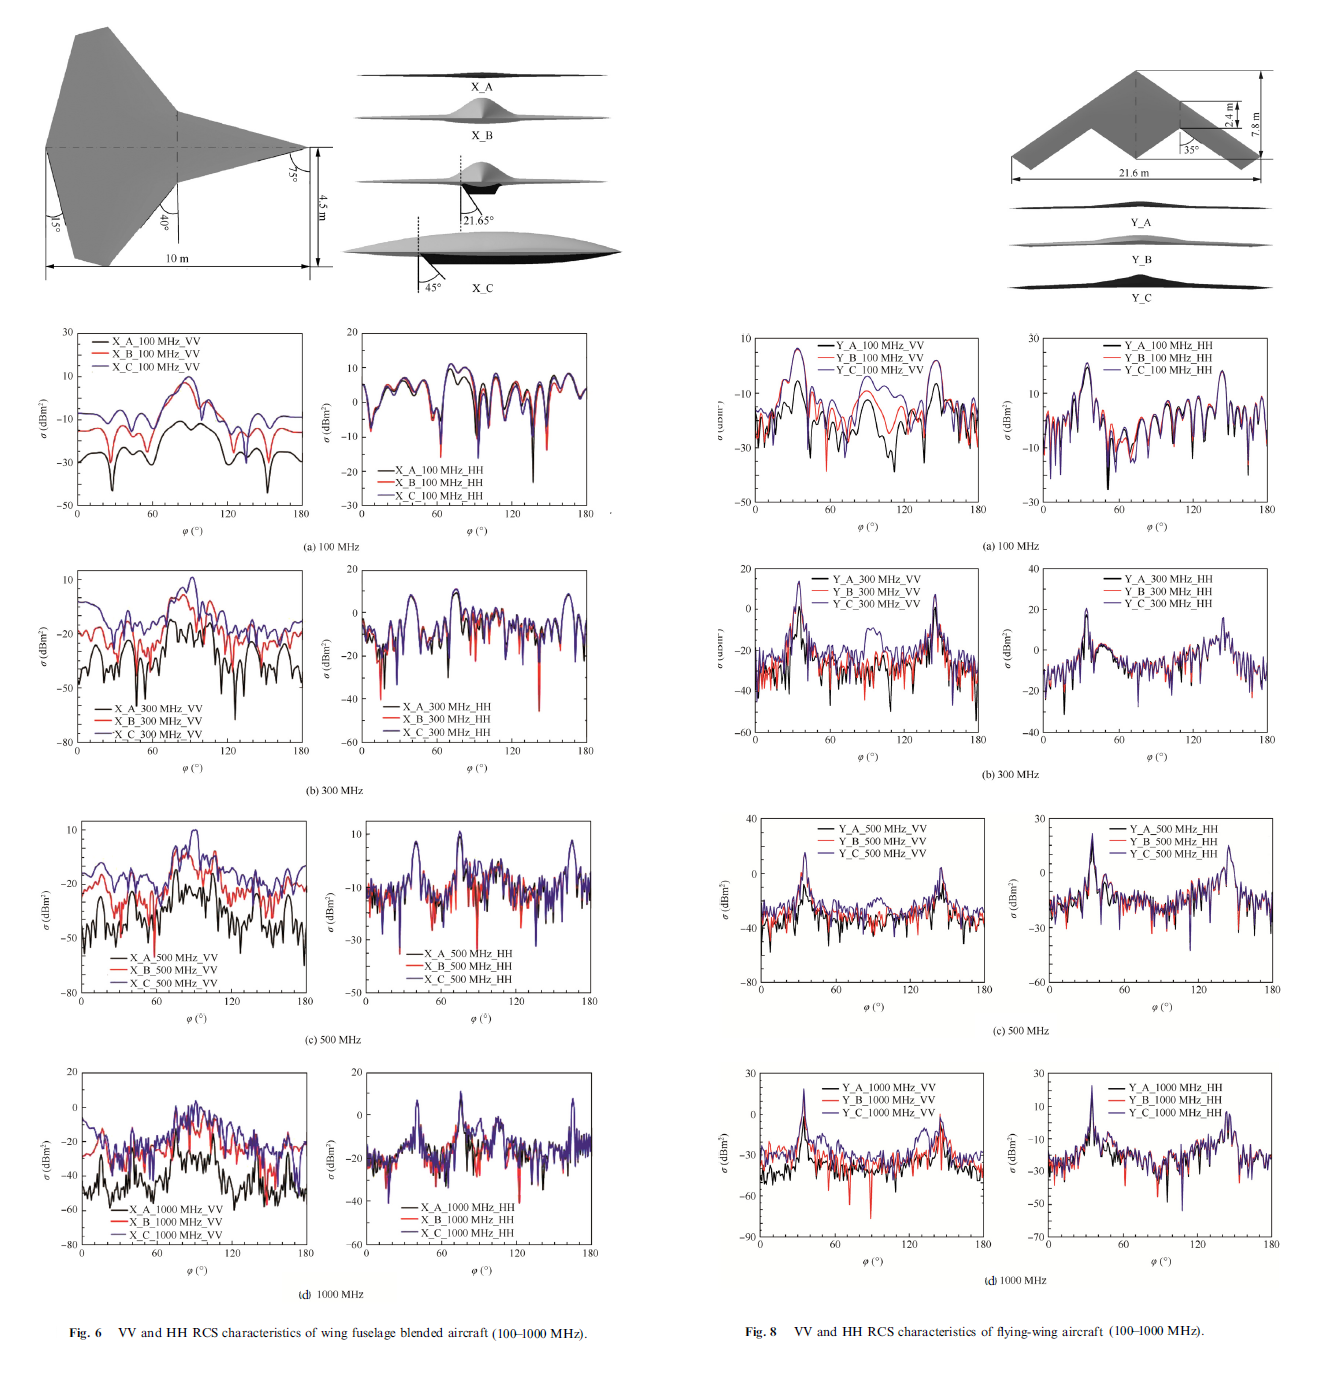
It is interesting to note that the polarization of radar also have an impact on their capabilities against stealth aircraft:
Against wing-fuselage blended stealth aircraft, their vertical polarized RCS (written as VV) is higher than the horizontal polarized RCS (written as HH) in most cases, while the RCS curve for the flying-wing stealth aircraft is just the opposite. For both stealth design, the RCS levels of horizontal and vertical polarized both decrease as the frequency increase, but the horizontal polarized RCS has a faster downward trend. The surface distribution has little influence on horizontally polarized RCS characteristics. On the contrary, it has a significant impact on Vertically polarized RCS characteristics, and the amplitude of the vertical polarized RCS increases with the spanwise cross-section thickness.
- Radar detection range and RCS


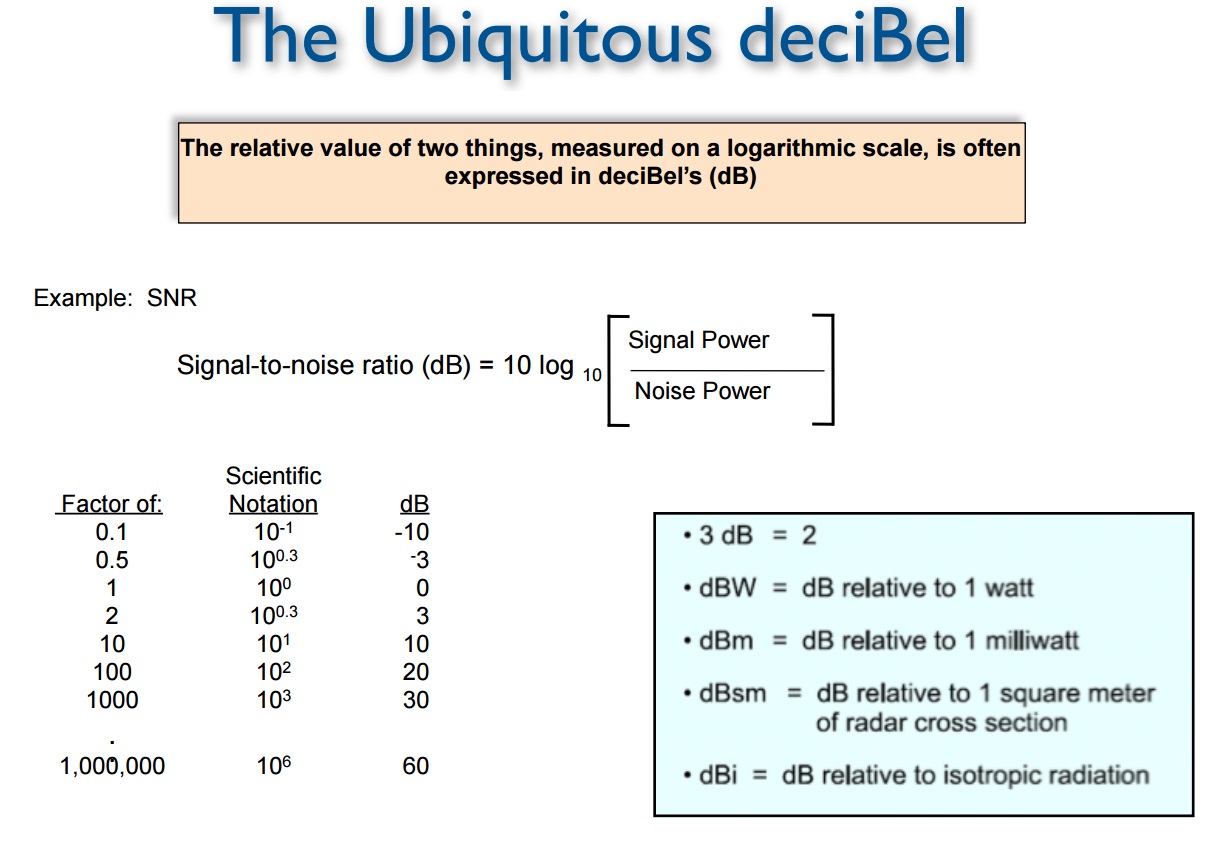
Decibel ( dB )
Radar Gain (directivity)

Most radiators emit stronger radiation in one direction than in another As a transmitting antenna, gain describes how well the antenna converts input power into radio waves headed in a specified direction. In layman term: Gain describe how narrow the radar beam is, high gain radars create narrow beam width, low gain radars create wide beam width. Narrow radar ‘s beam width benefits radar resolution and detection range while wide radar beam benefit sector scanning time. The relationship between radar gain and operating frequency , radar aperture is illustrated in the table below.

- Radar Beamwidth and Elevation-Azimuth Resolution

As stated earlier , radar beam width play a vital role in their angular accuracy characteristics because as long as targets stay within the radar beam, there will be reflection , the problem is if several targets fly close enough that their angular separation is smaller than the radar beamwidth, all the return echoes will be blended into one return , and radar will only display a single target on screen . To display two distinct radar returns of 2 target close to each other, radar beam needs to be able to pass between them without causing a return. Elevation-azimuth resolution is the ability of a radar to display two targets flying at approximately the same range with a certain angular separation, such as two fighters flying line-abreast tactical formation. The elevation-azimuth resolution capability is usually expressed in nautical miles and corresponds to the minimum angular separation required between two targets for separate display.
Angular resolution in nautical miles ( 1.852 km ) can be estimated by equation below

It important to remember that a radar vertical beamwidth is not necessary the same as it’s horizontal beamwidth. Hence, the azimuth and elevation resolution may be different.
- Range Resolution
Range resolution is the ability of a radar to separate two targets that are close together in range and are at approximately the same azimuth. The range resolution capability is determined by pulse width.A radar pulse in free space occupies a physical distance equal to the pulse width multiplied by the speed of light, which is about 984 feet per microsecond. If two targets are closer together than one-half of this physical distance, the radar cannot resolve the returns in range, and only one target will be displayed.

The range resolution of the radar is usually expressed in feet and can be computed using the equation below. It is the minimum separation required between two targets in order for the radar to display them separately on the radar scope so smaller value for range resolution is desirable

As explained earlier, the longer the pulse, the worse the resolution would be. Range resolution is proportional to pulse width and inverse proportional to bandwidth

Shorter pulse will improve range resolution but will also reduce the power of the transmitted radar wave, thus reduce radar detection range.
To improve radar detection range and range resolution at the same time, a technique called pulse compression was invented.
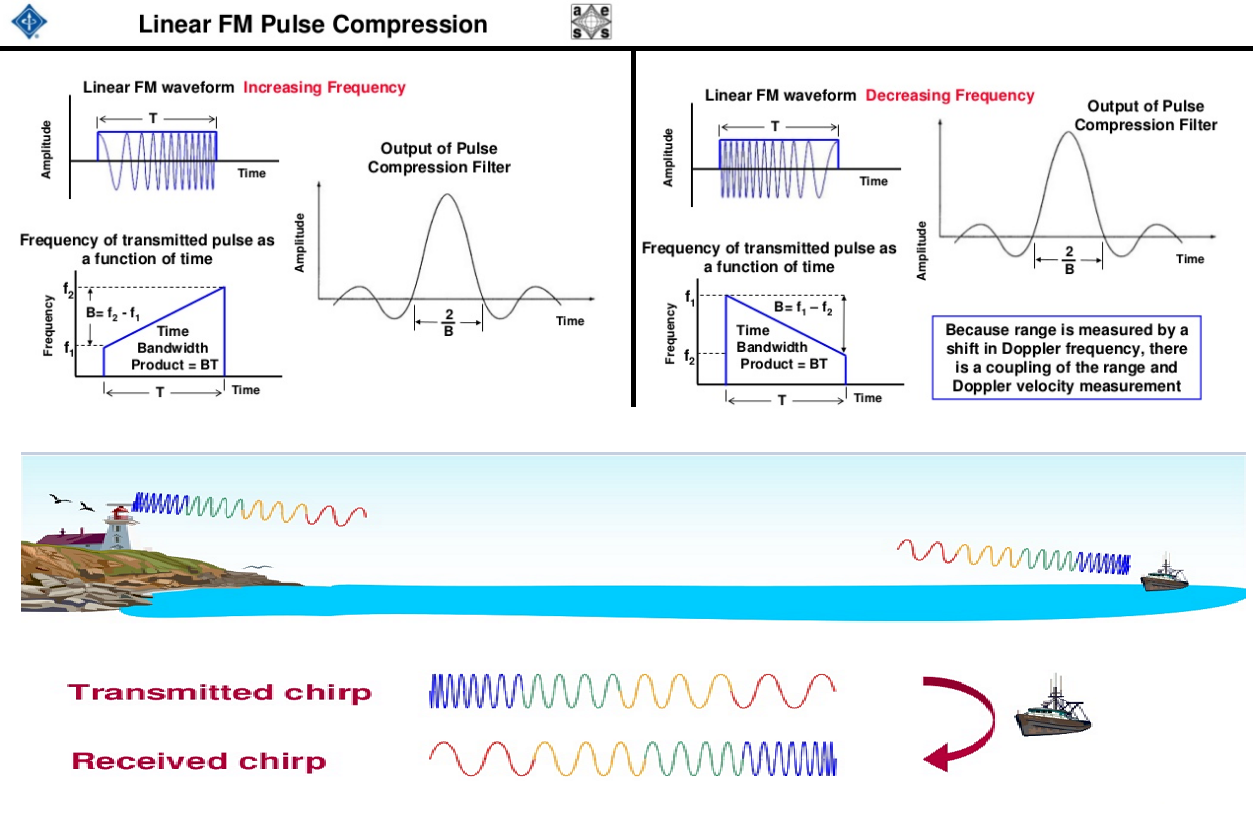
- Pulse compression
Pulse compression comes from the need to have large enough pulse without sacrifice range resolution. The basic principles of pulse compression are simple. Instead of transmitting a square pulse with the same characteristic from start to finish, radar instead transmits very long pulses that can be divided into several sub pulses after matched filtering.Thus, radar range resolution would then depend on the length of the sub pulses rather than total pulse length. Pulse compression can be either phase or frequency coded. One side benefit of code compression is that it makes radar much more resistance to jamming.

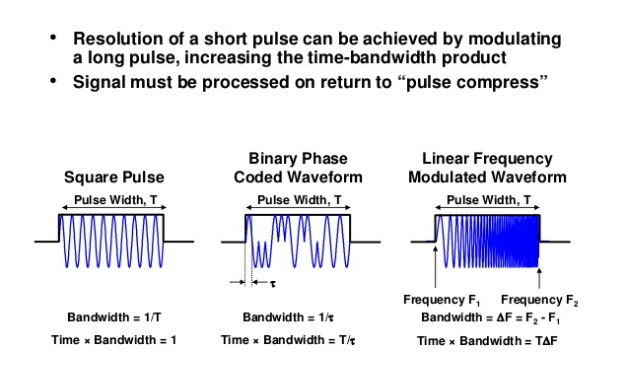
One of the first form of pulse compression is chirp compression (also known as linear frequency modulated pulse) where the frequency of pulse either increase or decrease with time.
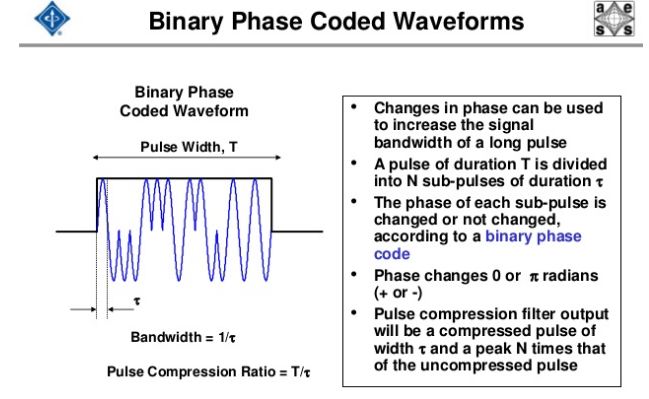
Because chirps compression is predictable for ECM and often require very wide bandwidth, another form of pulse compression called binary phase coded compression were invented. In phase coded compression, the phase is used to distinguish sub pulses instead of the frequency.
It is important to remember that chirp and binary phase coded pulse compression are only the two most basics forms of pulse compression, modern radar use various different kind of pulse compression such as Pseudo random noise sequences, Polyphase, Quadriphase, Costas code, Welti codes, Huffman code
Comparison between phase coded vs frequency coded pulse compression:

- Radar Resolution Cell

A radar’s pulse width, horizontal beamwidth, and vertical beamwidth form a three dimensional resolution cell. A resolution cell is the smallest volume of airspace in which a radar cannot determine the presence of more than one target. The resolution cell of a radar is a measure of how well the radar can resolve targets in range, azimuth, and altitude. The horizontal and vertical dimensions of a resolution cell vary with range. The closer to the radar, the smaller the resolution cell will be. The physical dimension of resolution cell can be easily calculated using equation given for range and angular resolution given above.
- Radar gain and radar detection range

Duty Cycle

Duty cycle is the fraction of the time that a system is in an “active” state. Duty cycle is the proportion of time during which a component, device, or system is operated. If a transmitter operates for 1 microsecond, and is shut off for 99 microseconds, then is run for 1 microsecond again, and so on. The transmitter runs for one out of 100 microseconds, or 1/100 of the time, and its duty cycle is therefore 1/100, or 1 percent. The duty cycle is used to calculate both the peak power and average power of a radar system.
Peak Power
The energy content of a continuous-wave radar transmission may be easily figured because the transmitter operates continuously. However, pulsed radar transmitters are switched on and off to provide range timing information with each pulse. The amount of energy in this waveform is important because the maximum range is directly related to transmitter output power. The more energy the radar system transmits, the greater the target detection range will be. Peak power is the amplitude, or power, of an individual radar pulse.
 .
.
Average Power

Average power is the power distributed over the pulse recurrence time. The energy transmitted by average power can be computed by multiplying average power by PRT. Since the energy in a set of pulses determines detection range, average power or energy provides a better measure of the detection range of a radar than does peak power. Average
power can be increased by increasing the PRF, by increasing the pulse width, or by increasing peak power.
Minimum Detectable Signal ( P-min )

Radar send out pulses and analyze reflection to detect and track targets. The reflection signal power is competing with some interfering signal in order to be detected or recognized. Interfering signal sources may be ground or sea returns, meteorological clutter returns, atmospheric reflections, jamming, or more likely, random noise generated within the receiving circuitry. The latter source is always present to some degrees, while the other sources are variable and can be zero. Therefore, the internal noise power is normally used for determining the maximum range of the radar system.The maximum range performance is determined by a very small signal to noise ratio when the signal begins to fade and become indistinguishable from the noise.
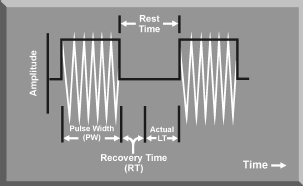
Rest Time
Rest time is the time between the end of one transmitted pulse and the beginning of the next. It represents the total time that the radar is not transmitting. Rest time is measured in microseconds
Recovery Time (RT)
A radar is not only a transmitter but also a receiver.Recovery time is the time immediately following transmission time during which the receiver is unable to process returning radar energy. RT is determined by the amount of isolation between the transmitter and receiver and the efficiency of the duplexer. A part of the high power transmitter output spills over into the receiver and saturates this system. The time required for the receiver to recover from this condition is RT
Listening time (LT)
Listening time is the time the receiver can process target returns often express in microseconds. Listening time is measured from the end of the recovery time to the beginning of the next pulse, or PRT- (PW + RT).
The relationship between recovery time, rest time and listening time is illustrated in the diagram below
References
- Adamy, D., “Seduction Decoys”, Journal of Electronic Defense, Vol. 20, No 7,pp. 58-59, July, 1997.
- Adamy, D., “EW 101”, Journal of Electronic Defense, Vol. 21, No 1, pp. 14-19,January, 1998.
- Chrzanowshi, E. J., “Active Radar Electronic Countermeasures”, Artec House, Inc., Norwood, MA, 1990.
- Neri, F.,” Introduction to Electronic Defense Systems”, Artec House, Inc., Norwood, MA, 1990.
- Skolnik, M. L., “Introduction to Radar Systems”, McGraw-Hill, Inc., New York, NY, 1980.
- 4513 ATTG/INW, Advanced Radar Principles for Electronic Combat, 15 April 1991.
- “Electronic Warfare Fundamentals”NOVEMBER 2000,Nellis AFB NV
- J.M. Headric and M. I. Skolnik. “Over-the-horizon radar in the HF band.” in Proceedings of IEEE, Vol. 6, pp. 664-672, 1974.
- J. M. Headrick. “HF over-the-horizon radar.” in Radar Handbook, 2nd ed., M. I. Skolnik, New York: McGraw-Hill,1990.
- L. Sevgi. “Stochastic modeling of target detection and tracking in surface wave high frequency radars.” Int. J. of Numerical Modeling, Vol. 11, No 3, pp.167-181, May 1998.
- L. Sevgi, A. M. Ponsford. “Multi-sensor, multi-resolution integrated maritime surveillance systems.” inIEEE Signal Processing and Applications Symp. (SIU’99), June 16-19, 1999, Ankara, Turkey.
- L. Sevgi, A. M. Ponsford. “Multi-sensor integrated maritime surveillance systems.” in IEEE International Multi-Conference on Circuits, Systems, Communications and Computers (CSCC’99), July 4-8, 1999, Athens, Greece.
- L. Sevgi, A. M. Ponsford, H.C. Chan. “An integrated maritime surveillance system based on surface wave HF radars, Part I – Theoretical background and numerical simulations.” IEEE Antennas and Propagation Magazine, V.43, N.4, pp.28-43, Aug. 2001.
- A. M. Ponsford, L. Sevgi, H.C. Chan. “An integrated maritime surveillance system based on surface wave HF radars, Part II – Operational status and system performance.” IEEE Antennas and Propagation Magazine, V.43., N.5, pp.52-63, Oct. 2001
- M. C¸akır, G. C¸ akır, L. Sevgi. “Parallel FDTD-based radar cross section (RCS) simulations.” in Fifth International Conference on Electrical and Electronics Engineering (ELECO 2007), Dec 5-9, 2007, Bursa, Turkey.
- G. C¸akır, M. C¸ akır, L. Sevgi. “Radar cross section (RCS) modeling and simulation: Part II – A novel FDTD-based RCS prediction virtual tool.” IEEE Antennas and Propagation Magazine, Vol. 50, No.2, pp.81-94, Apr 2008.
- Gonca C¸AKIR1, Levent SEVG˙I2″Radar cross-section (RCS) analysis of high frequency surface wave radar targets”Turk J Elec Eng & Comp Sci, Vol.18, No.3, 2010
- G.T. Ruck, D.E. Barrick, W.D. Stuart and C.K. Krichbaum, Radar Cross-Section
Handbook, Vol. 1, New York: Plenum Press, 1970. - C.W. Trueman, S.J. Kubina, S.R. Mishra and C. Larose, “RCS of four fuselage-like
scatterers at HF frequencies,” IEEE Trans. Antennas and Propagation, vol. AP-40,
no. 2, Feb. 1992, pp. 236-240. - Dr. Robert M. O’Donnell IEEE New Hampshire Section Guest Lecturer”Radar Systems Engineering”
- Professor Oleg I. Sukharevsky “Electromagnetic Wave Scattering by Aerial and Ground Radar Objects”2015
- Williams/Cramp/Curtis: Experimental study of the radar cross-section of maritime targets,Electronic Circuits and Systems, Vol. 2, No. 4,July 1978
- P.Bhartia, I.Bahl, Millimeter-Wave Engineering and Applications, John Wiley & Sons, 1984
- JIANG Hao, ANG Hai-song”The Analysis of Aerodynamic and Stealth Characteristic of F-35 Fighter”College of Aerospace Engineering, Nanjing University of Aeronautics and Astronautics, Nanjing 210016, China
- (STEPHEN TRIMBLE Flight Global 2010 ) accessed 20 March 2016 < https://www.flightglobal.com/news/articles/eurofighter-boasts-typhoon-reign-over-f-35-345265/ >
- Physics And Progress Of Low-Frequency Counterstealth Technology (accessed 25 August 2016 ) Aviation Week & Space Technology ,Daniel Katz
.

Hello, I discover your blog via the forum on acig, you advice us to take a look at it under the name “elytorian” so first of all I have to congratulate you and thank you very much to share these infos with us.
I write you because I’m need an update for these three docs :
Click to access RSPA2L.pdf
Click to access SURVSTD.pdf
These two docs comes from Eurocontrol and as I understand they were writed in 1997, now in 2018 is there any new docs for the same matter in “open sources” from Eurocontrol or any other place.
And finally this one coming from IOAC
http://www.caa.lv/file/937/280
All of these are related to the test evaluation of a radar and it’s precisely what I’m searching for…
Sorry to bother you.
Best wishes.
Paul.
LikeLike
This is a really great article.
However I have to disagree with you on the Acronym description of “R A D A R.” The bible we used when I studied R A D A R in the Navy in the early sixties was the Air Force Radar Manual.
It stated the acronym was derived from the words:
RADIO AZIMUTH DETECTION AND RANGING. I still had a copy of that manual until 1985 when it was destroyed in a house fire.
LikeLike
This is one of the best articles i have read on radar….In-depth and detailed…Please continue posting
LikeLike